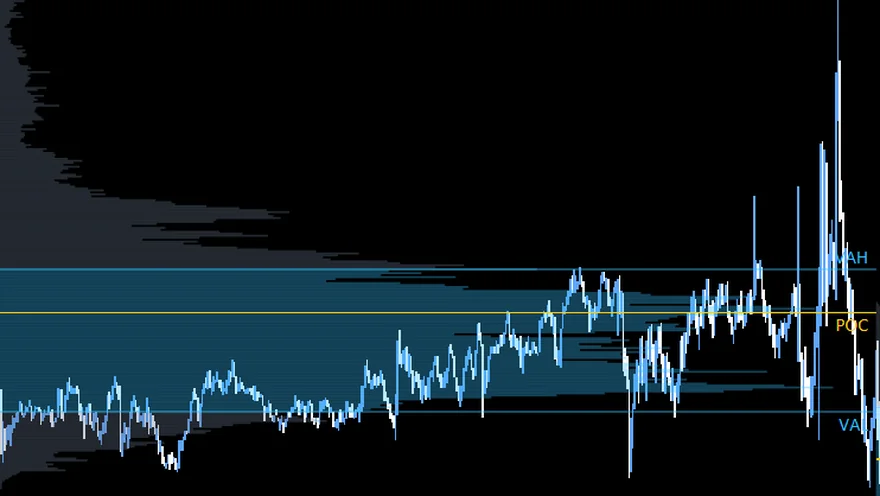
Balance (D-shape)
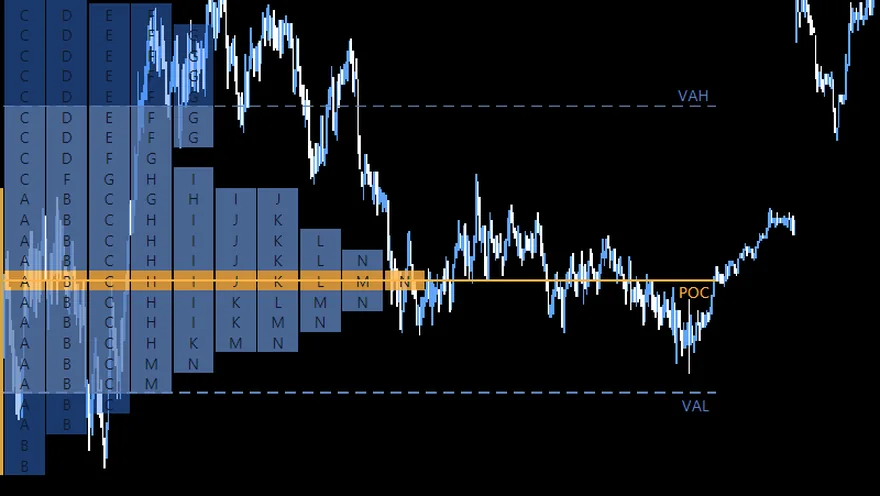
Volume builds in the middle, both sides trade. The market is in balance – fade the edges, not the middle.
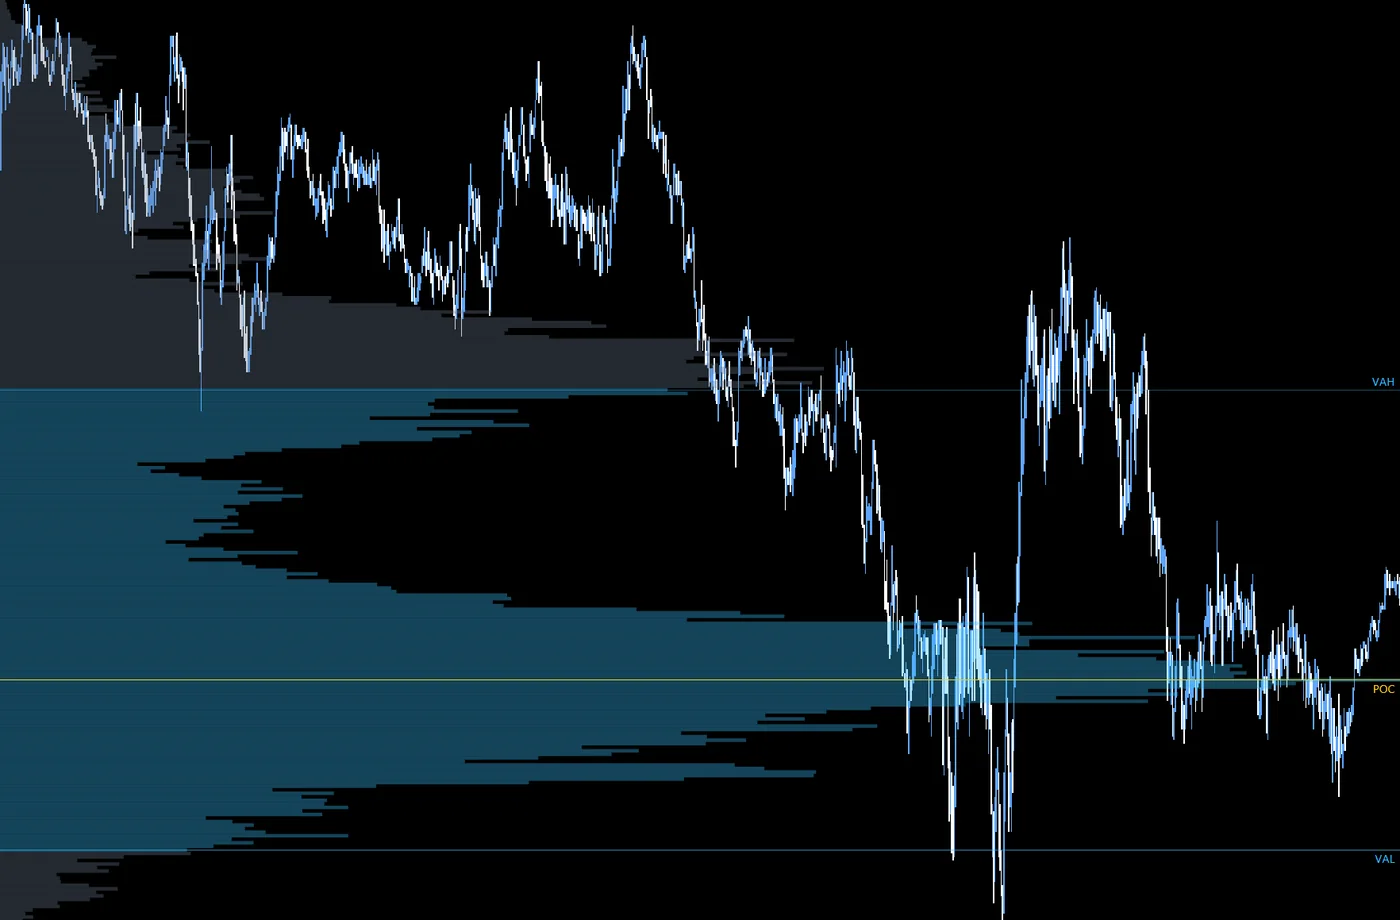
A normal chart shows volume over time. The volume profile turns it by 90 degrees: it adds up every contract traded at each price and shows it as a horizontal bar.
The result shows where the market found a fair price and where it only passed through. The price with the most volume is the point of control (POC), the area with 70 % of all volume is the value area.
You get:
Six shapes and levels that tell you what the market is doing.
Volume builds in the middle, both sides trade. The market is in balance – fade the edges, not the middle.
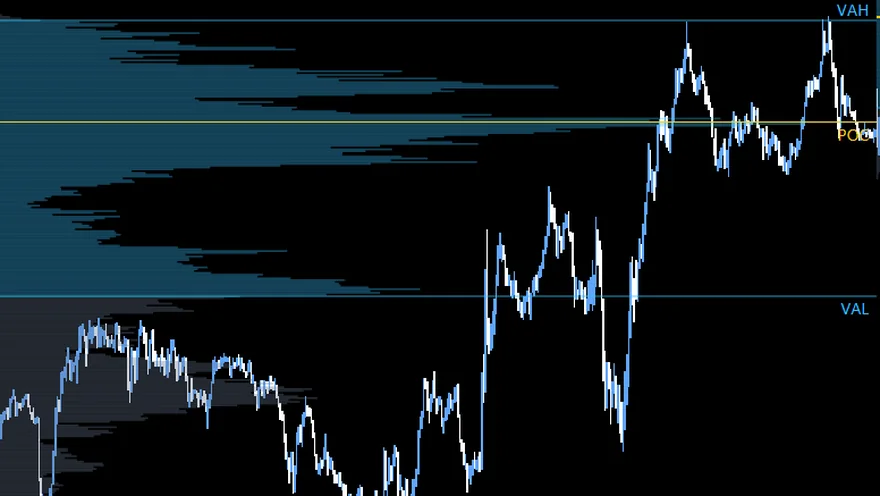
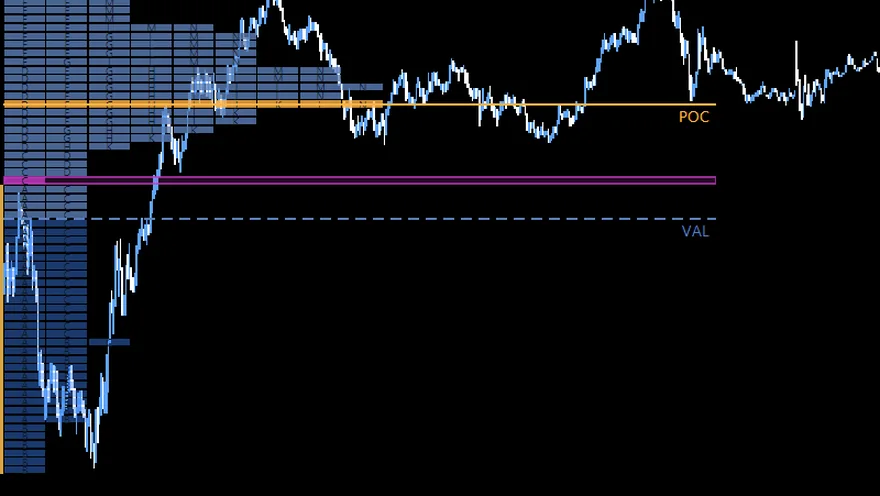
A fast move up, then value builds at the top. Often short covering or new buyers accepting higher prices.
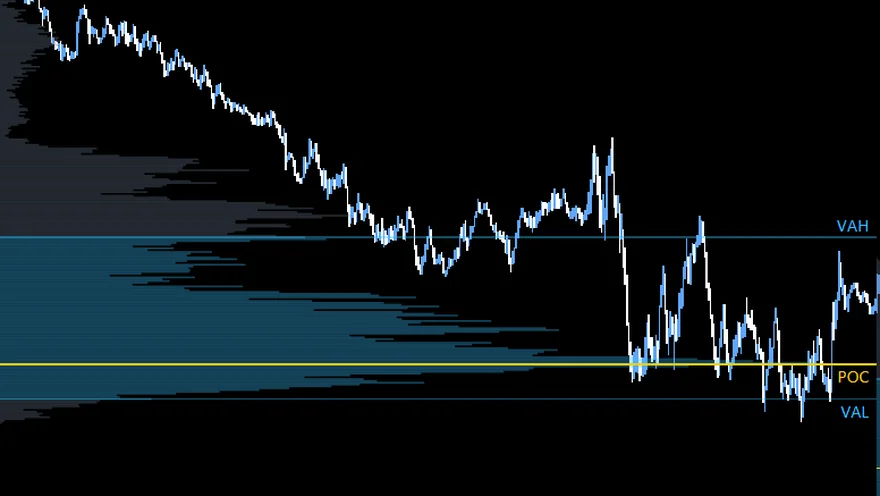
The mirror image: a fast drop, then value builds at the bottom. Typical for long liquidation.
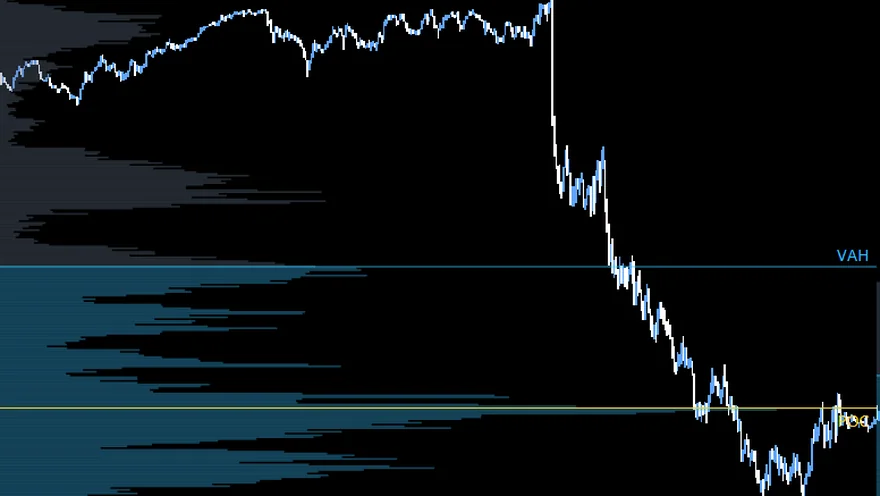
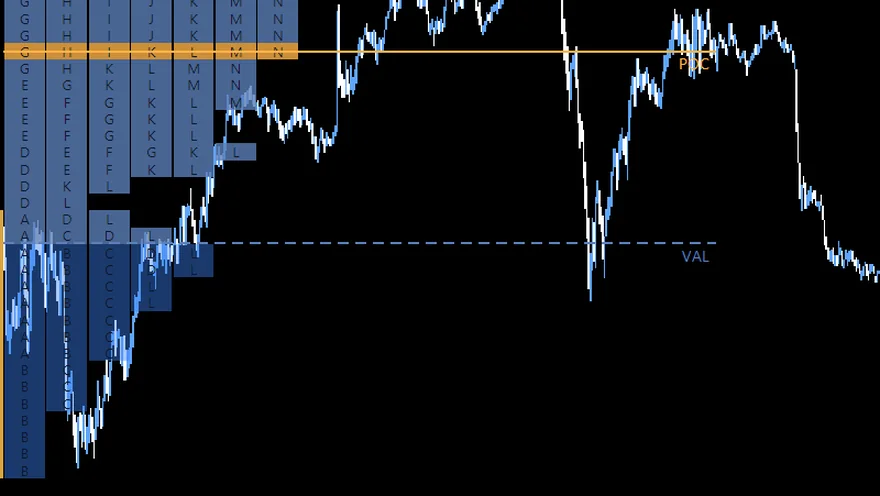
Two areas of value with a thin zone in between. The market moved from one fair price to a new one.
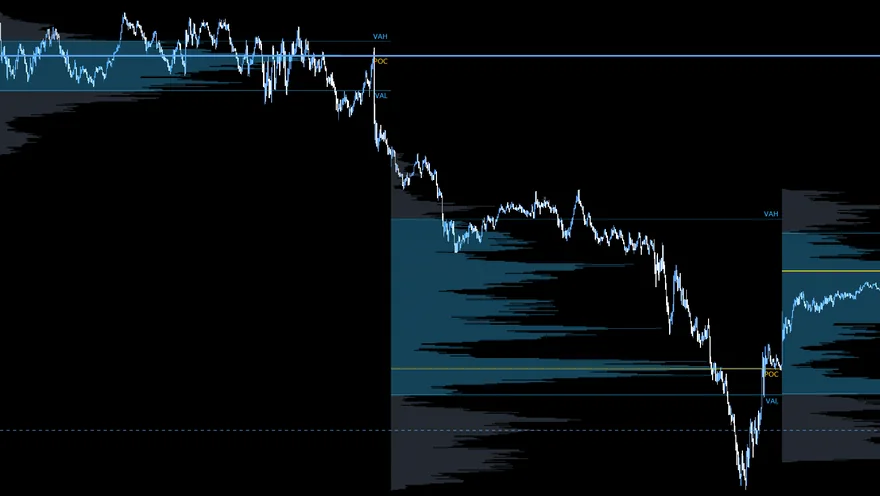
A POC from an earlier session that price has not touched again. These levels often act as magnets.
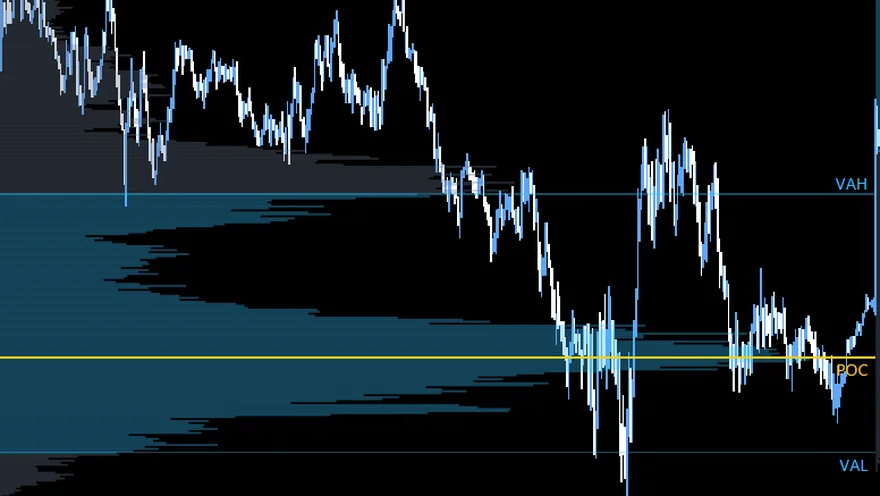
Little was traded here, so price moves through quickly – and often reacts when it comes back.
Real excerpts from the EdgeCharts app: ES volume profiles from 14 October to 2 November 2026.
Per session, across several days or for exactly the range you need – one click on the chart.
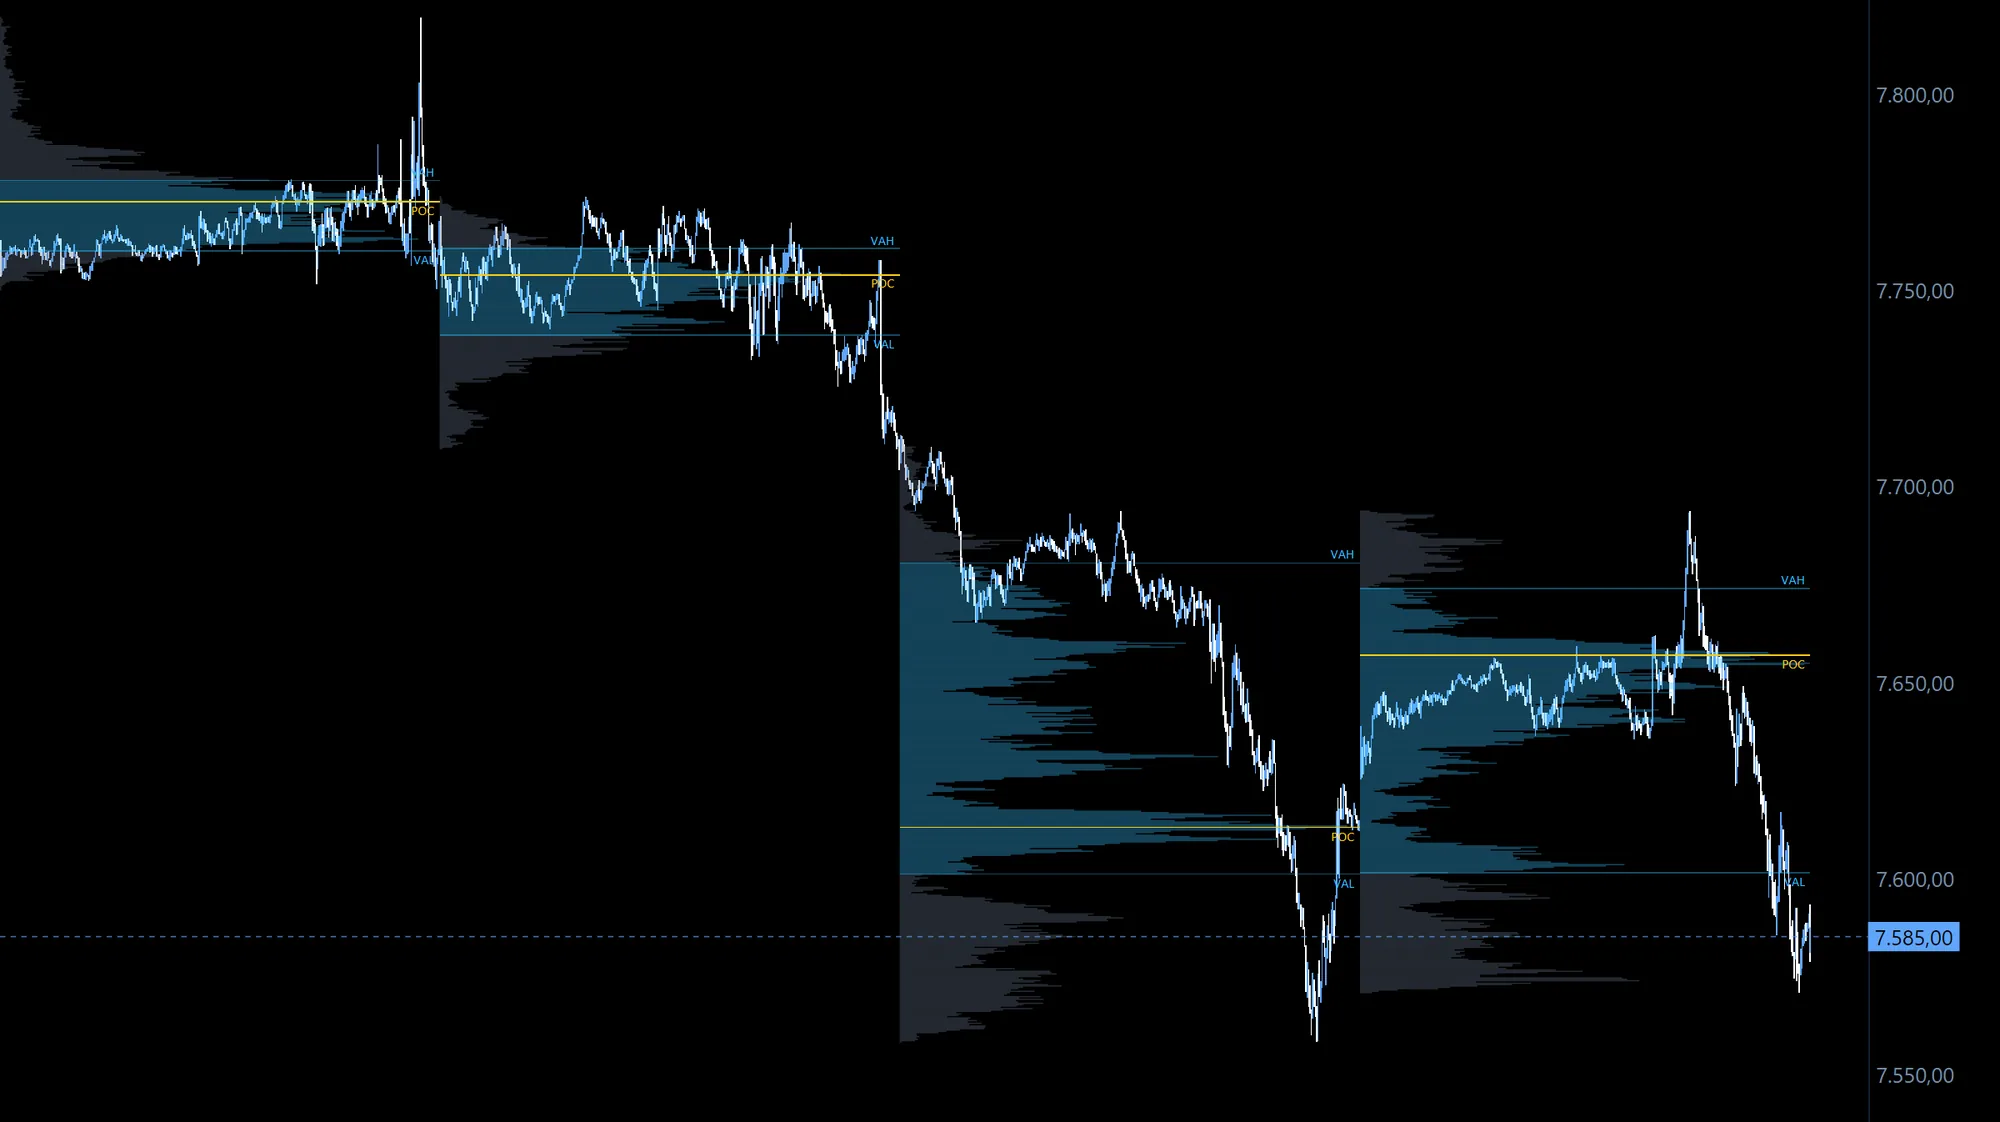
Value area, POC and volume nodes show you the levels that really matter – for entries, targets and stops.
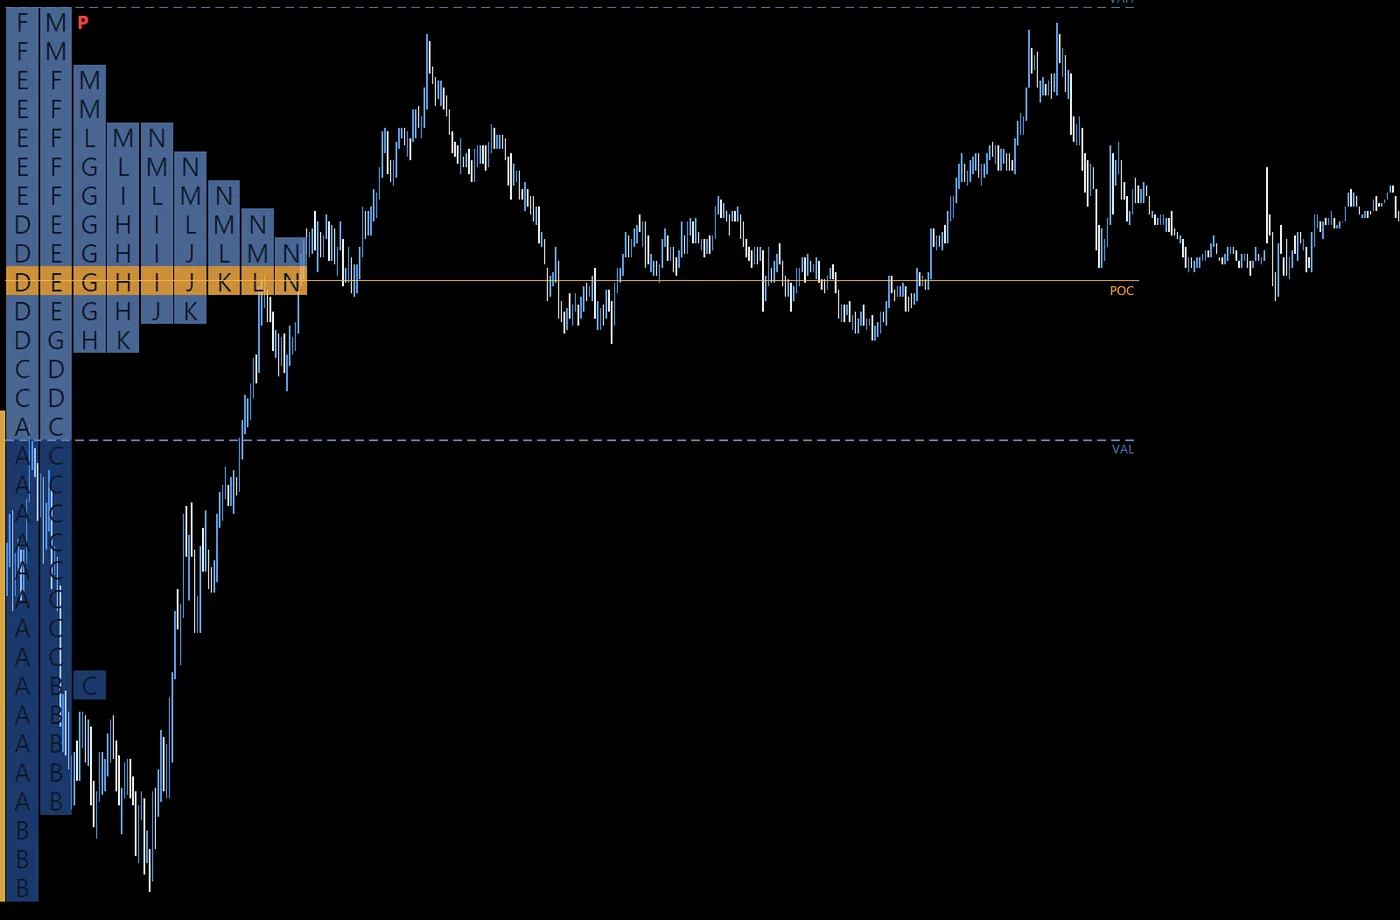
The market profile measures time instead of volume. The session is split into 30-minute periods, each with its own letter – A for the first, B for the second and so on.
Every price a period trades at gets its letter. Stacked from left to right, the letters form the profile: wide rows are prices the market accepted, thin rows are prices it rejected.
You get:
Six patterns that show you what kind of day it is.
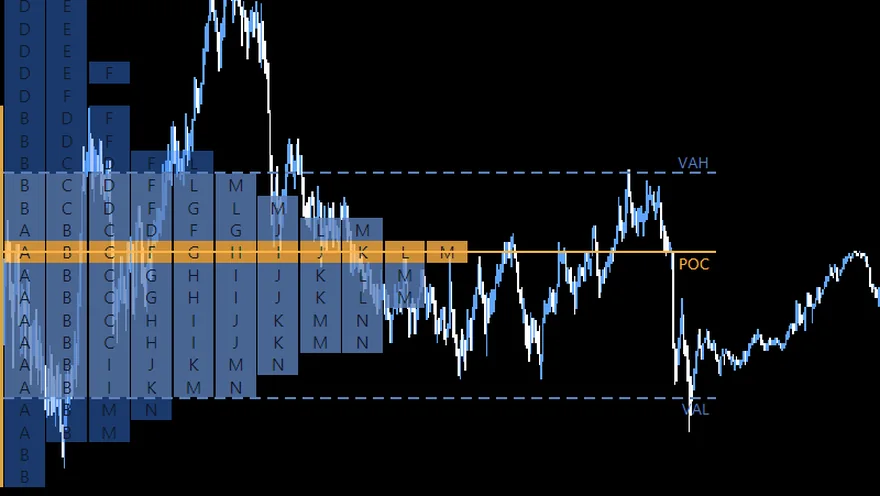
The initial balance holds most of the day. Price rotates inside it and forms a wide, balanced profile.
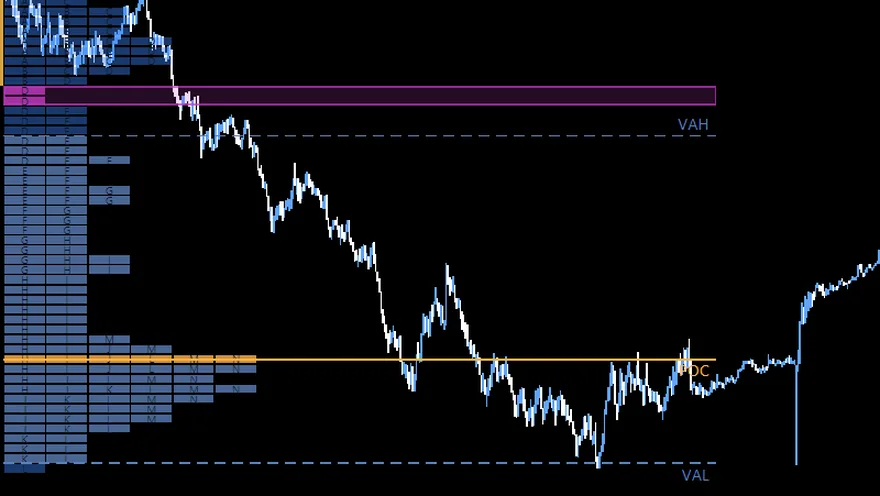
Each period opens and closes in one direction. A thin, elongated profile – do not fight it.
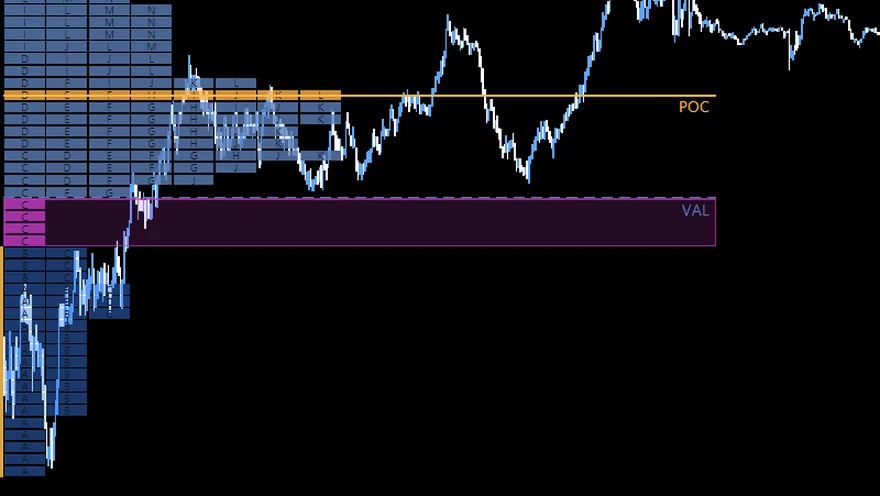
Two balance areas, connected by single prints. The market found a new fair price during the day.
Prices only one period traded at. A sign of fast, one-sided business – often support or resistance later.
Several TPOs at the extreme instead of a clean tail. The auction is unfinished – price likes to come back.
Price leaves the initial balance of the first hour. The range extension shows who takes control.
Real excerpts from the EdgeCharts app: ES market profiles of the regular session, 15 to 27 October 2026.
Letters, blocks or split by period – choose how much detail you want to see.
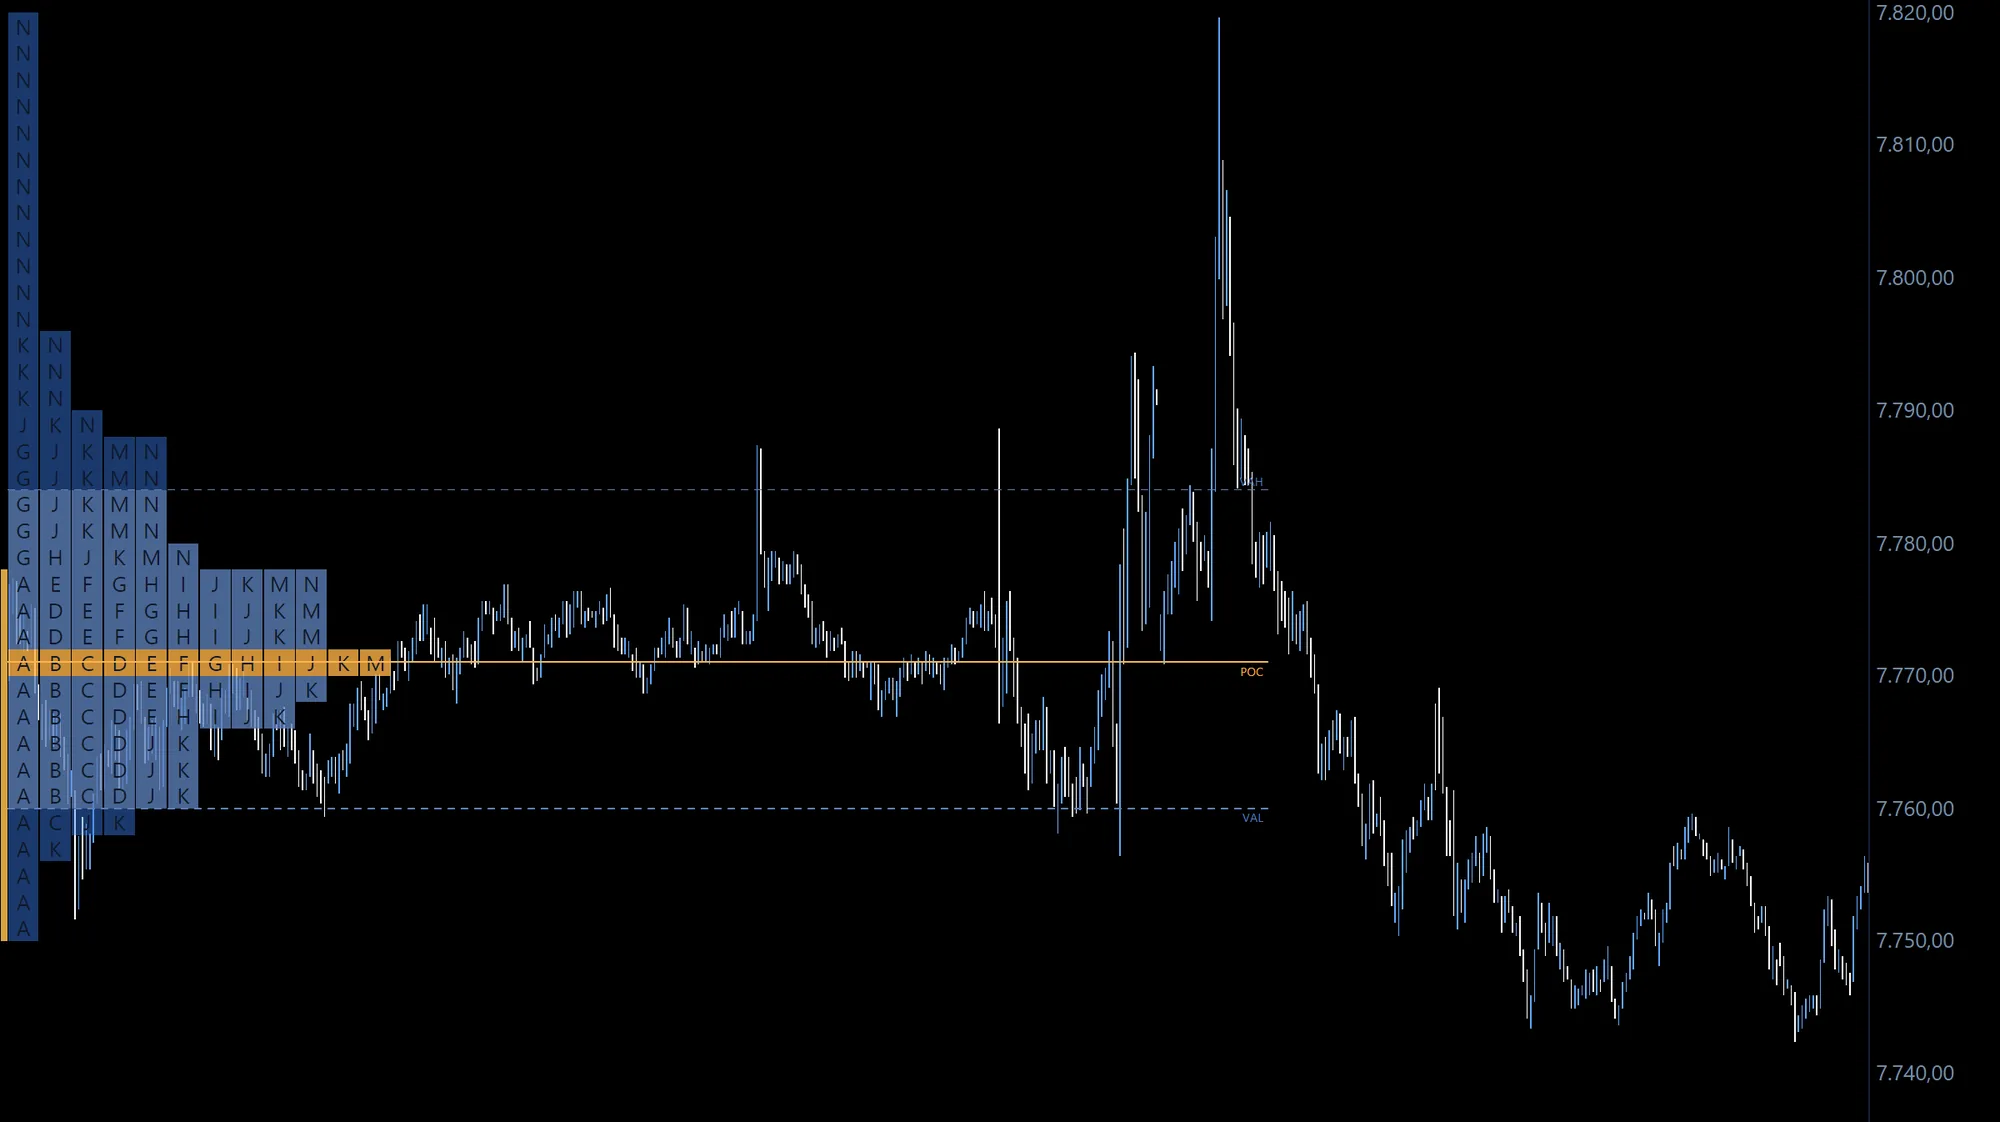
Period by period, letter by letter. The market profile shows you where the market spent its time – and where it left in a hurry.