


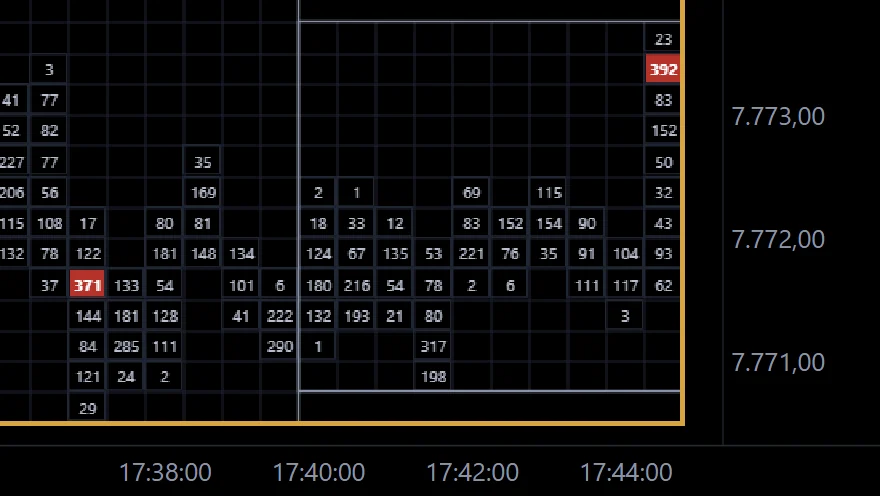
Overlapping boxes
Box after box at the same level, each with a small range. The market is in balance – it is waiting for a reason to move.
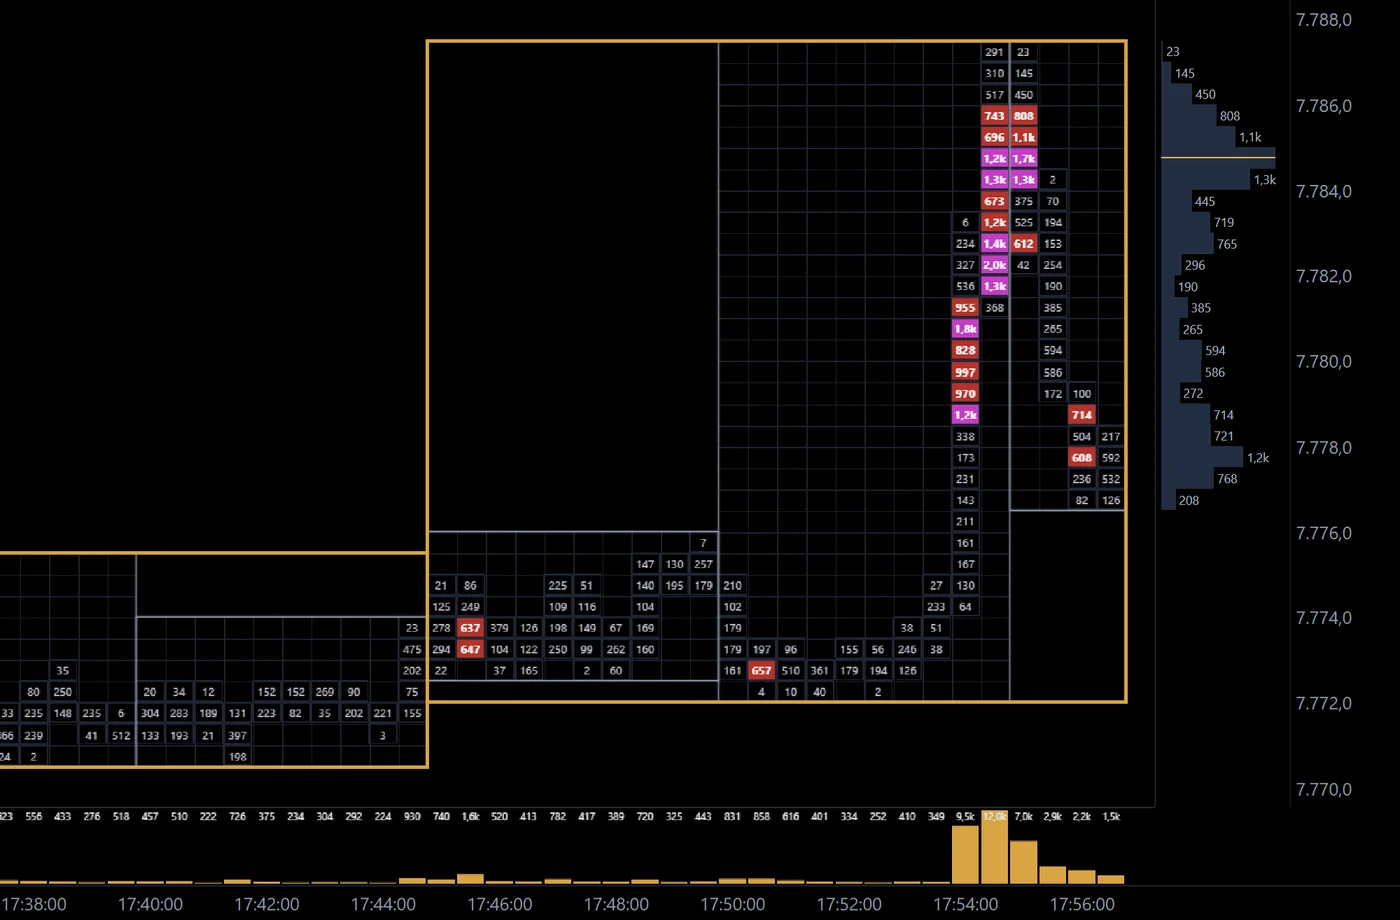
A box chart splits the session into very short bars – 30 seconds here, down to one second in EdgeCharts. Every column is one bar, every row one price level, and every cell holds a number: the volume traded there, the delta, the largest single order or one of six other values.
Around the bars EdgeCharts draws boxes. Box 1 frames a fixed period such as five minutes – exactly from its high to its low. An optional Box 2 groups several of them into a larger frame. You read the auction period by period instead of candle by candle.
You get:
From an empty tab to your own box chart – market, boxes and thresholds are saved for next time.
Click + in the tab bar, choose Box and your market.
Pick the bar, Box 1 and – if you like – Box 2.
Cell content, histogram, profile and DOM.
Set the thresholds from which cells are coloured.
Colours, grid, time window and cut breaks under the gear.
Six patterns that boxes make easy to see.
Box after box at the same level, each with a small range. The market is in balance – it is waiting for a reason to move.
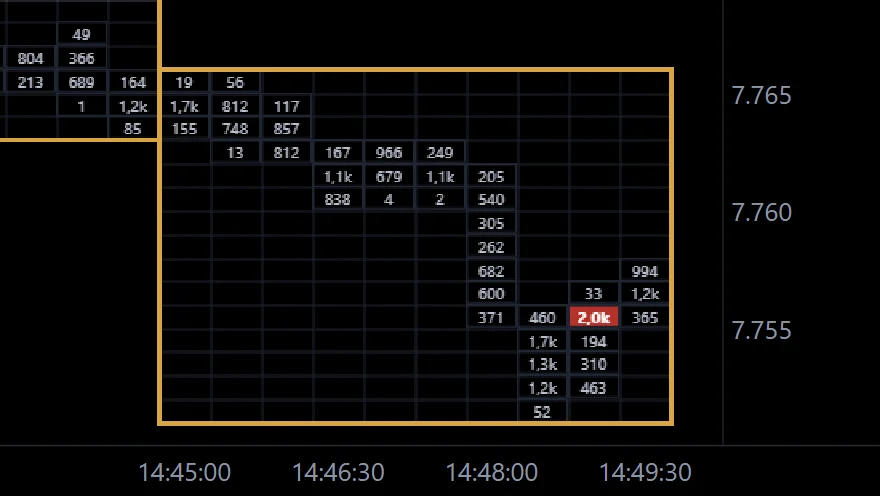
Price leaves the range of the previous box and volume grows at the new prices. The bigger the numbers on the way out, the more conviction behind the move.
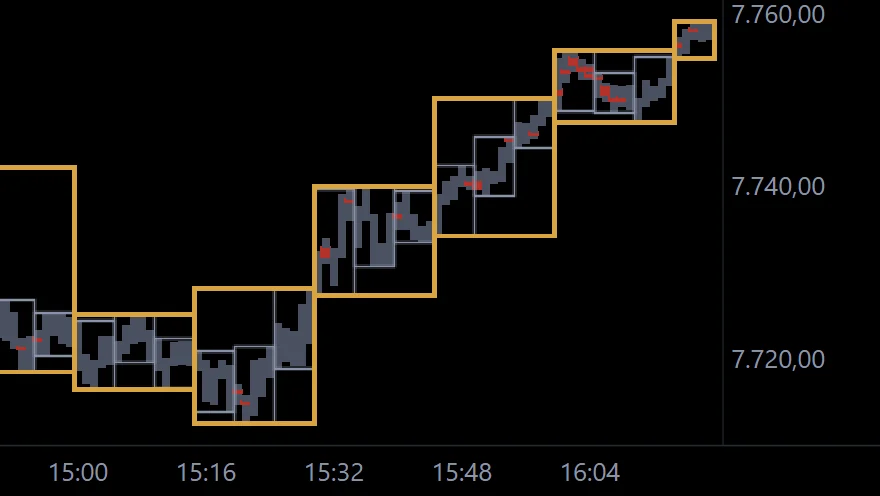
After the low of the day every box sets a higher high and a higher low. Zoomed out, EdgeCharts draws the path instead of numbers.
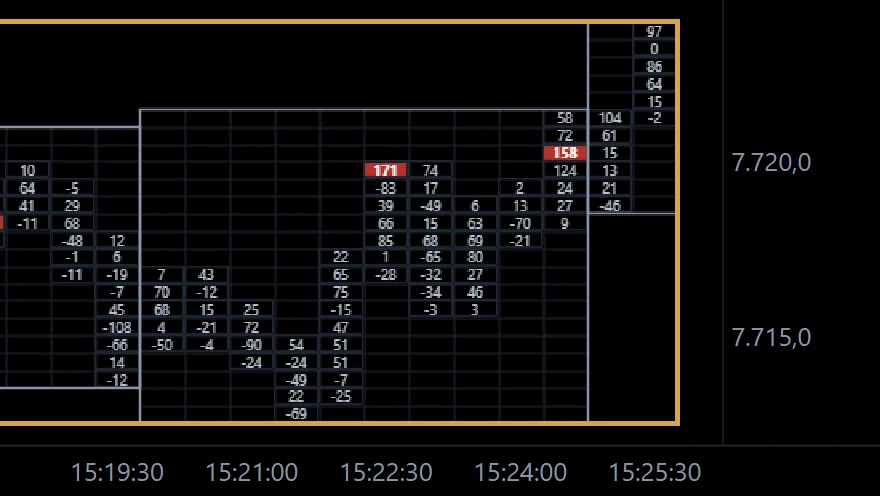
At the low the cells still show selling – negative delta. Then the sign flips, buyers dominate the next bars and price leaves the low.
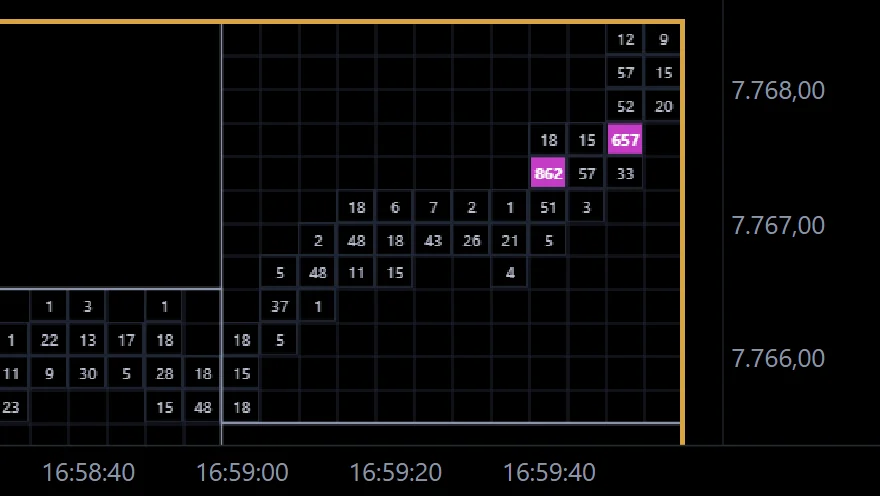
The largest single order in each cell. Here a single buy order of 862 contracts – where the other cells show a handful of lots.
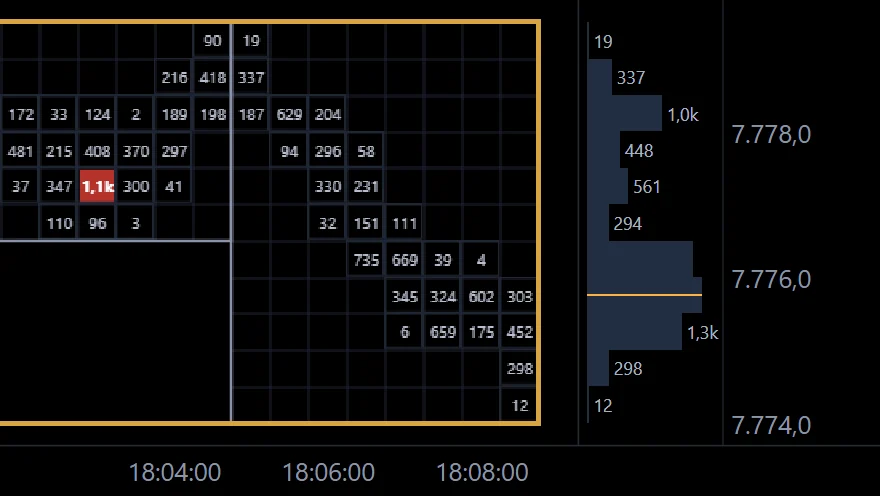
Beside the running box EdgeCharts draws its profile – volume or delta per price, with the POC in gold. You see at once where the box accepts price.
Real excerpts from the EdgeCharts app: ES box charts on 27 and 28 October 2026.
Nine cell contents, one click in the toolbar. The same minutes read completely differently in each.
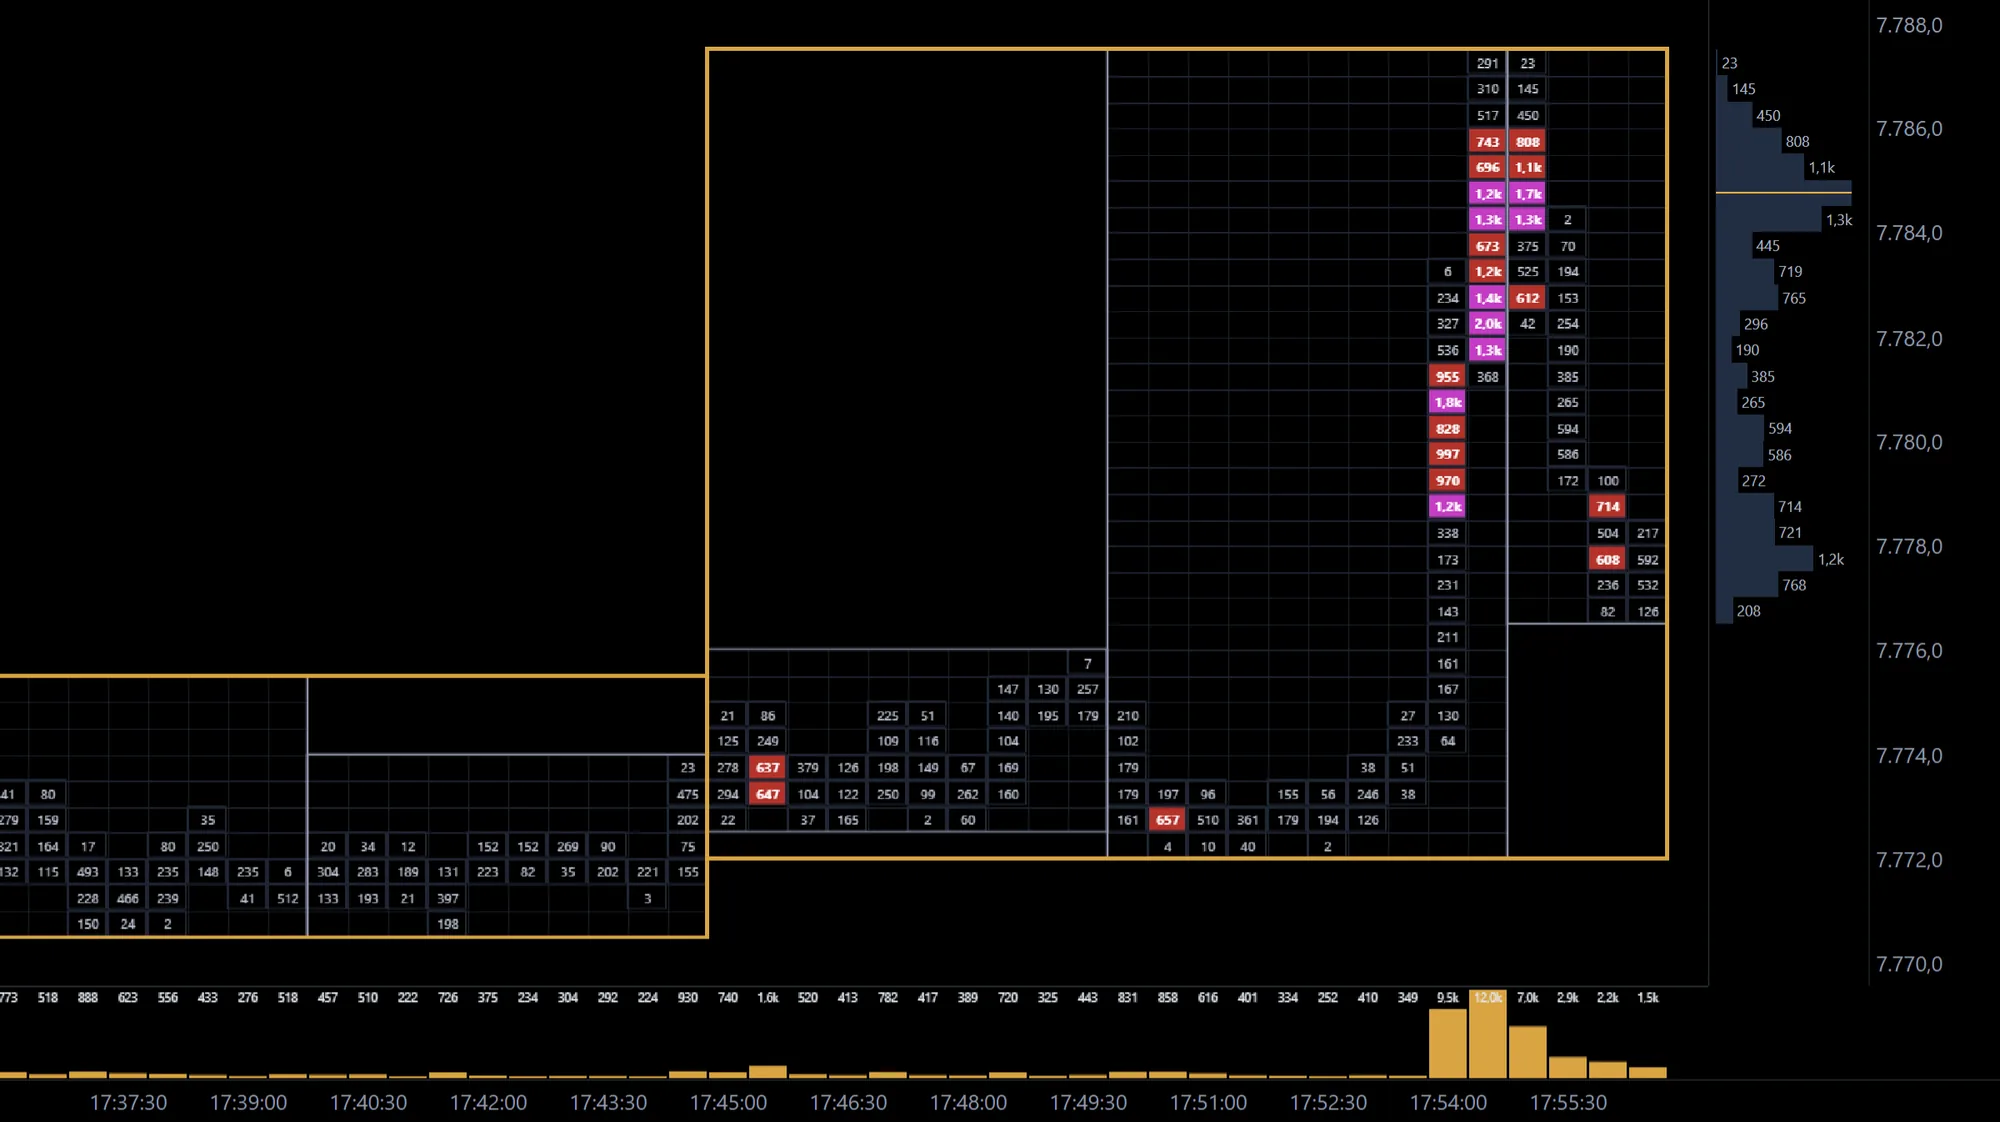
Short bars, clear frames, coloured thresholds – the box chart shows where the market really traded and when it changed its mind.