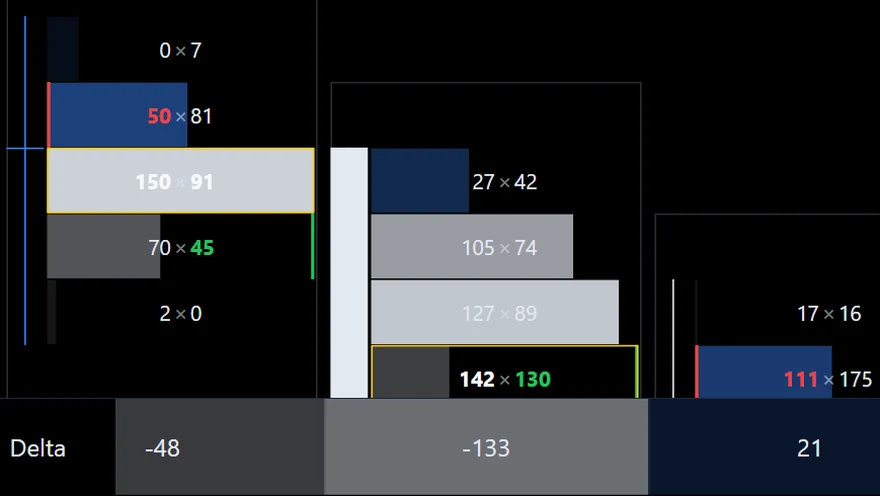
Delta
Ask volume minus bid volume. Shows whether buyers or sellers were more aggressive – per price level and per candle.
EdgeCharts builds every footprint from tick-by-tick exchange data, delivered through Rithmic or dxFeed. Each trade carries its price, its size and the side that started it.
Within each candle, every trade is sorted to its price level – sells on the left, buys on the right. The result is a numerical cluster for every candle.
You get:
Six patterns that turn the numbers into decisions.
Ask volume minus bid volume. Shows whether buyers or sellers were more aggressive – per price level and per candle.
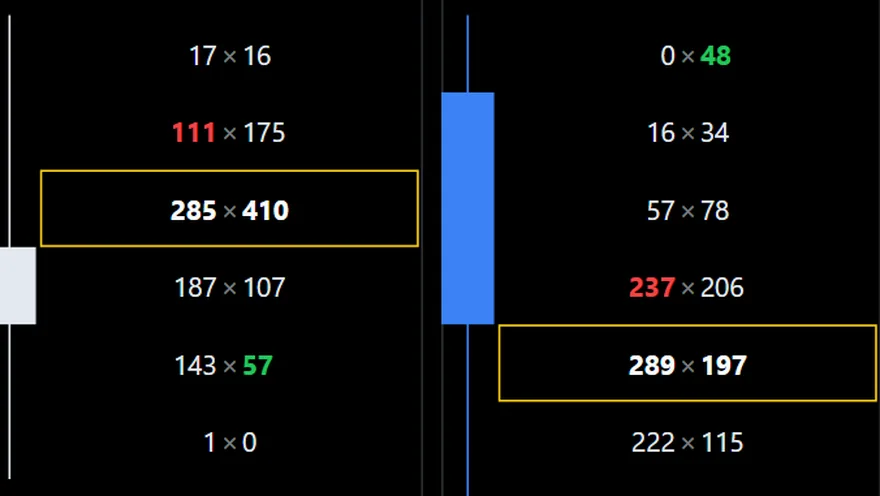
Compared diagonally: ask at one price against bid one tick below. Above your set ratio, EdgeCharts highlights the cell.
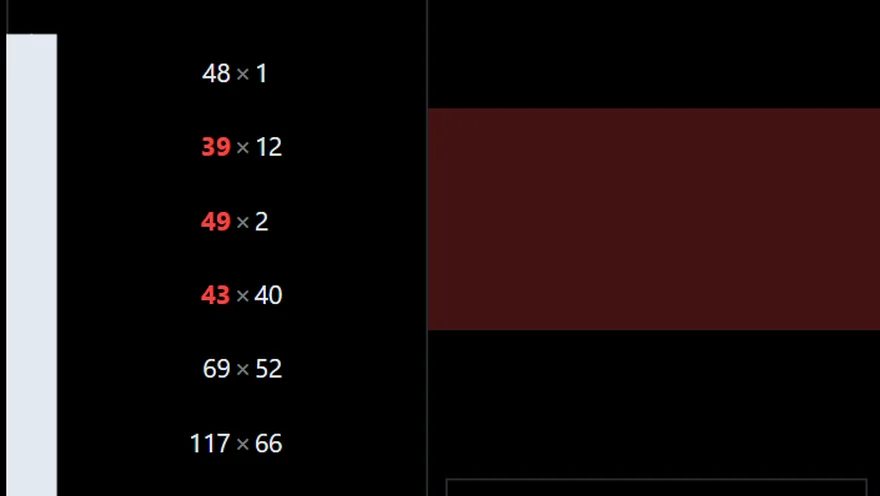
Three or more imbalances in a row form a zone. Often a level the market defends when price returns.
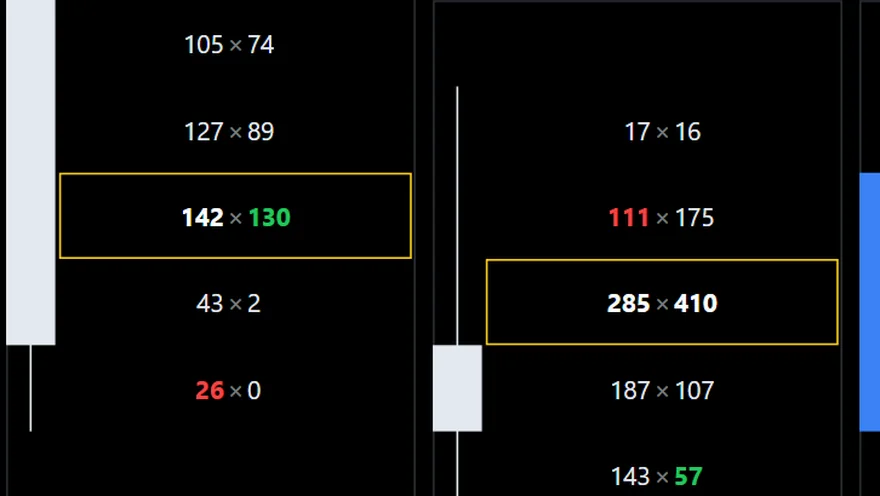
The price with the most volume inside the candle. Shows where the market accepted price.
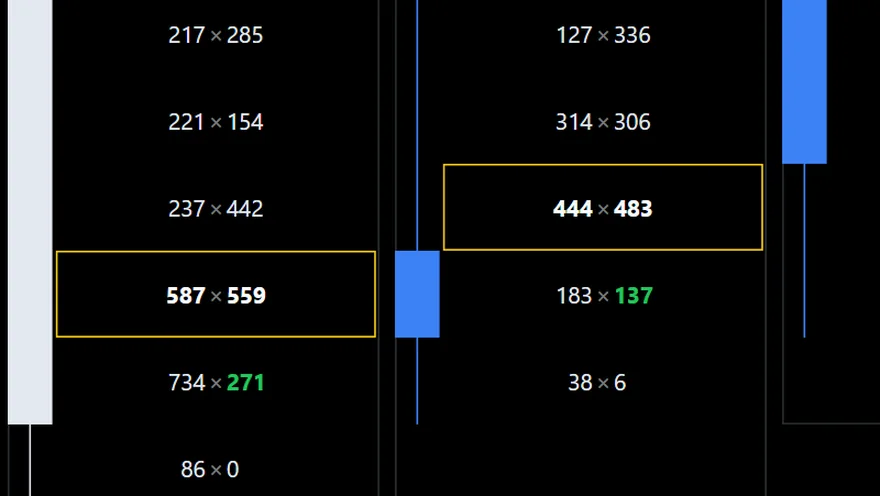
Heavy selling at the low, but price does not fall further. Passive buyers absorb the aggression.
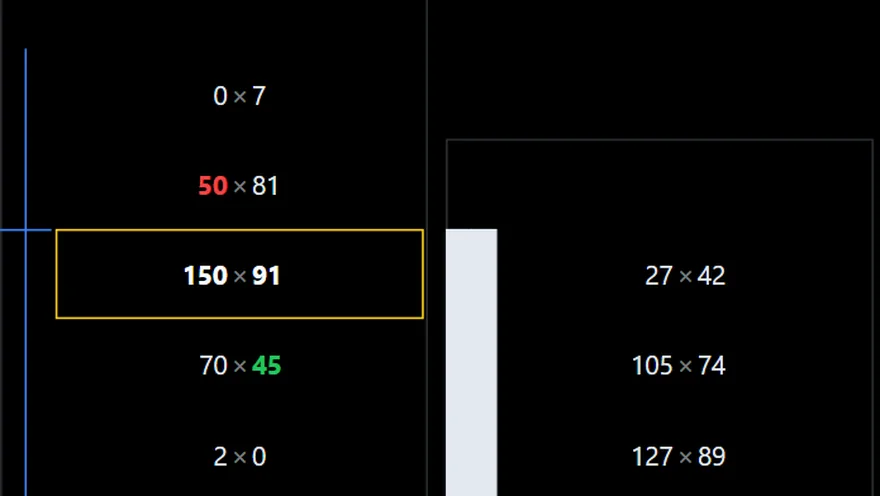
Volume dries up at the extreme of the candle. Nobody is left to push price further.
Real excerpts from the EdgeCharts app: ES footprint on 30 October and 2 November 2026.
The view decides what each cell shows. Switch with one click – the settings stay saved per chart.
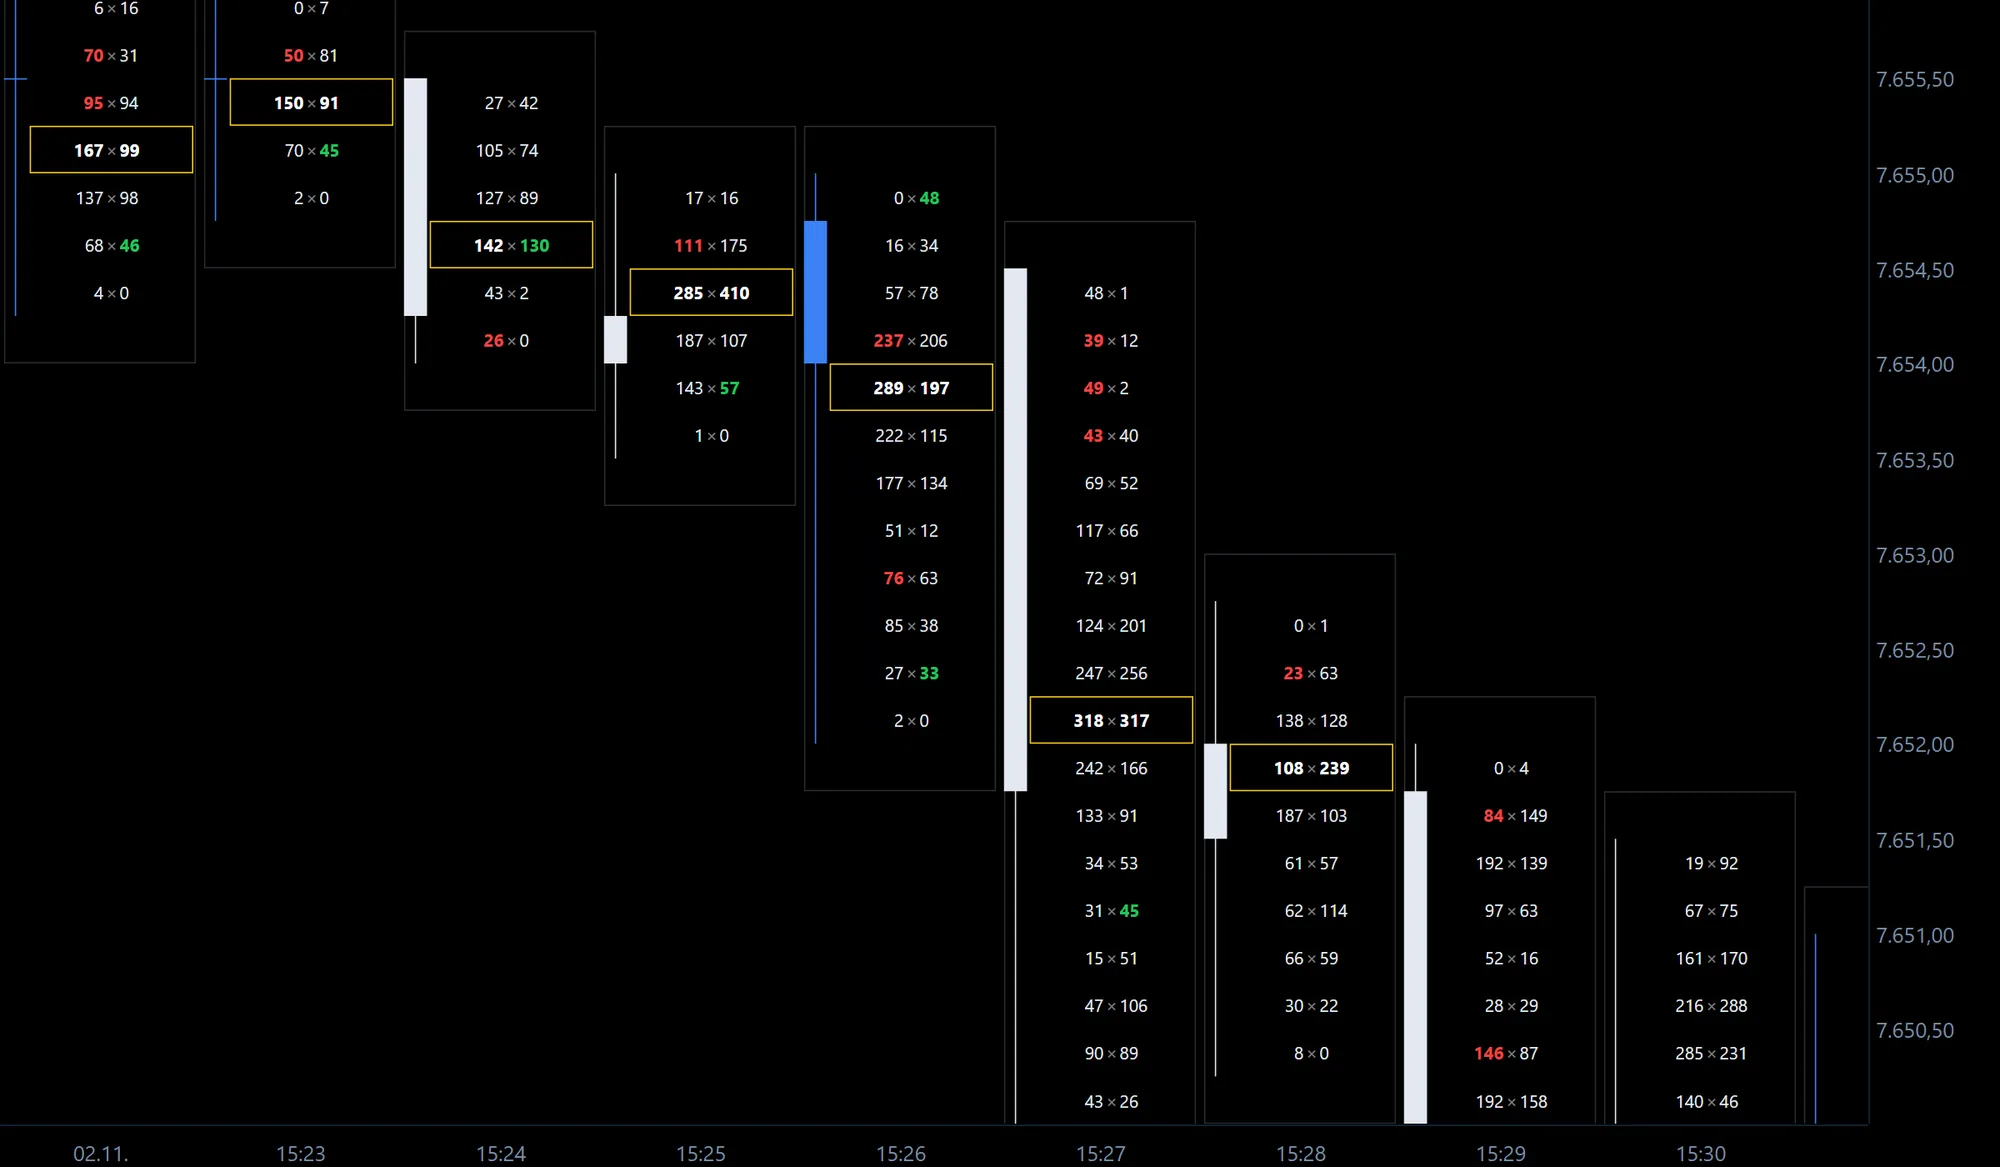
A candle shows four prices. The footprint shows who traded at every price in between – how much was bought, how much was sold, and who was aggressive.