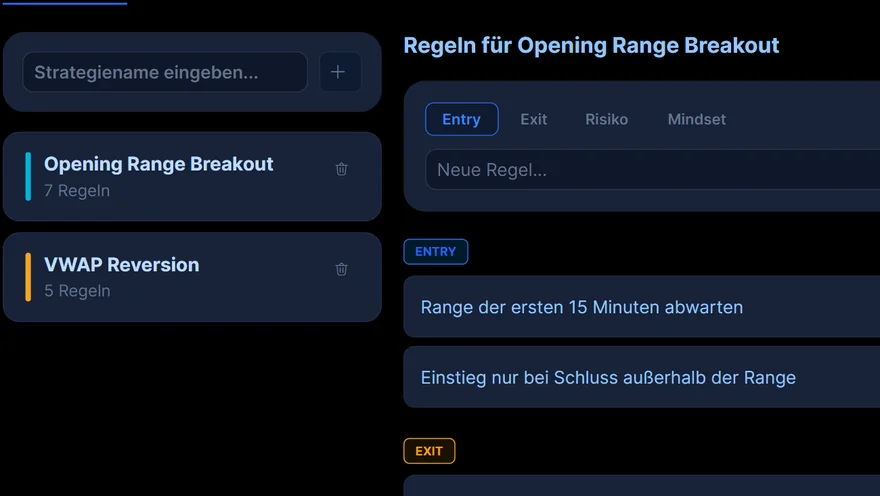
Playbook
Write down your strategies with entry, exit, risk and mindset rules – your plan in one place.
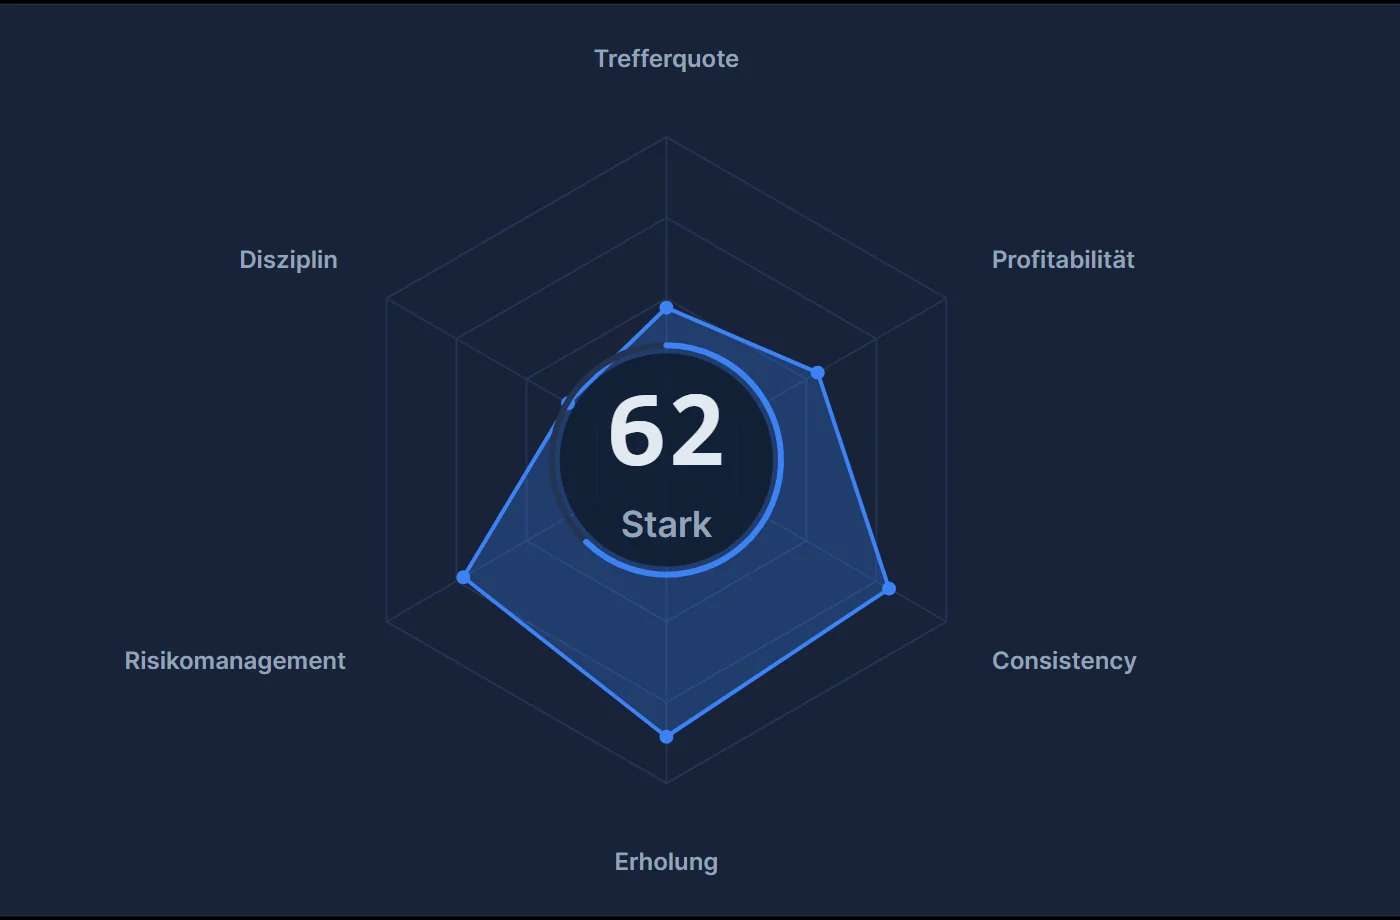
The Optimizer rates your trading on six axes – win rate, profitability, consistency, recovery, risk management and discipline. Together they make your Trade Score from 0 to 100.
All values come from your real trades and your playbook reviews. No guessing, no gut feeling.
You get:
Every point is one hour on one weekday. Peaks are your strong hours, valleys the ones that cost you money. In the app you rotate and tilt the surface freely.
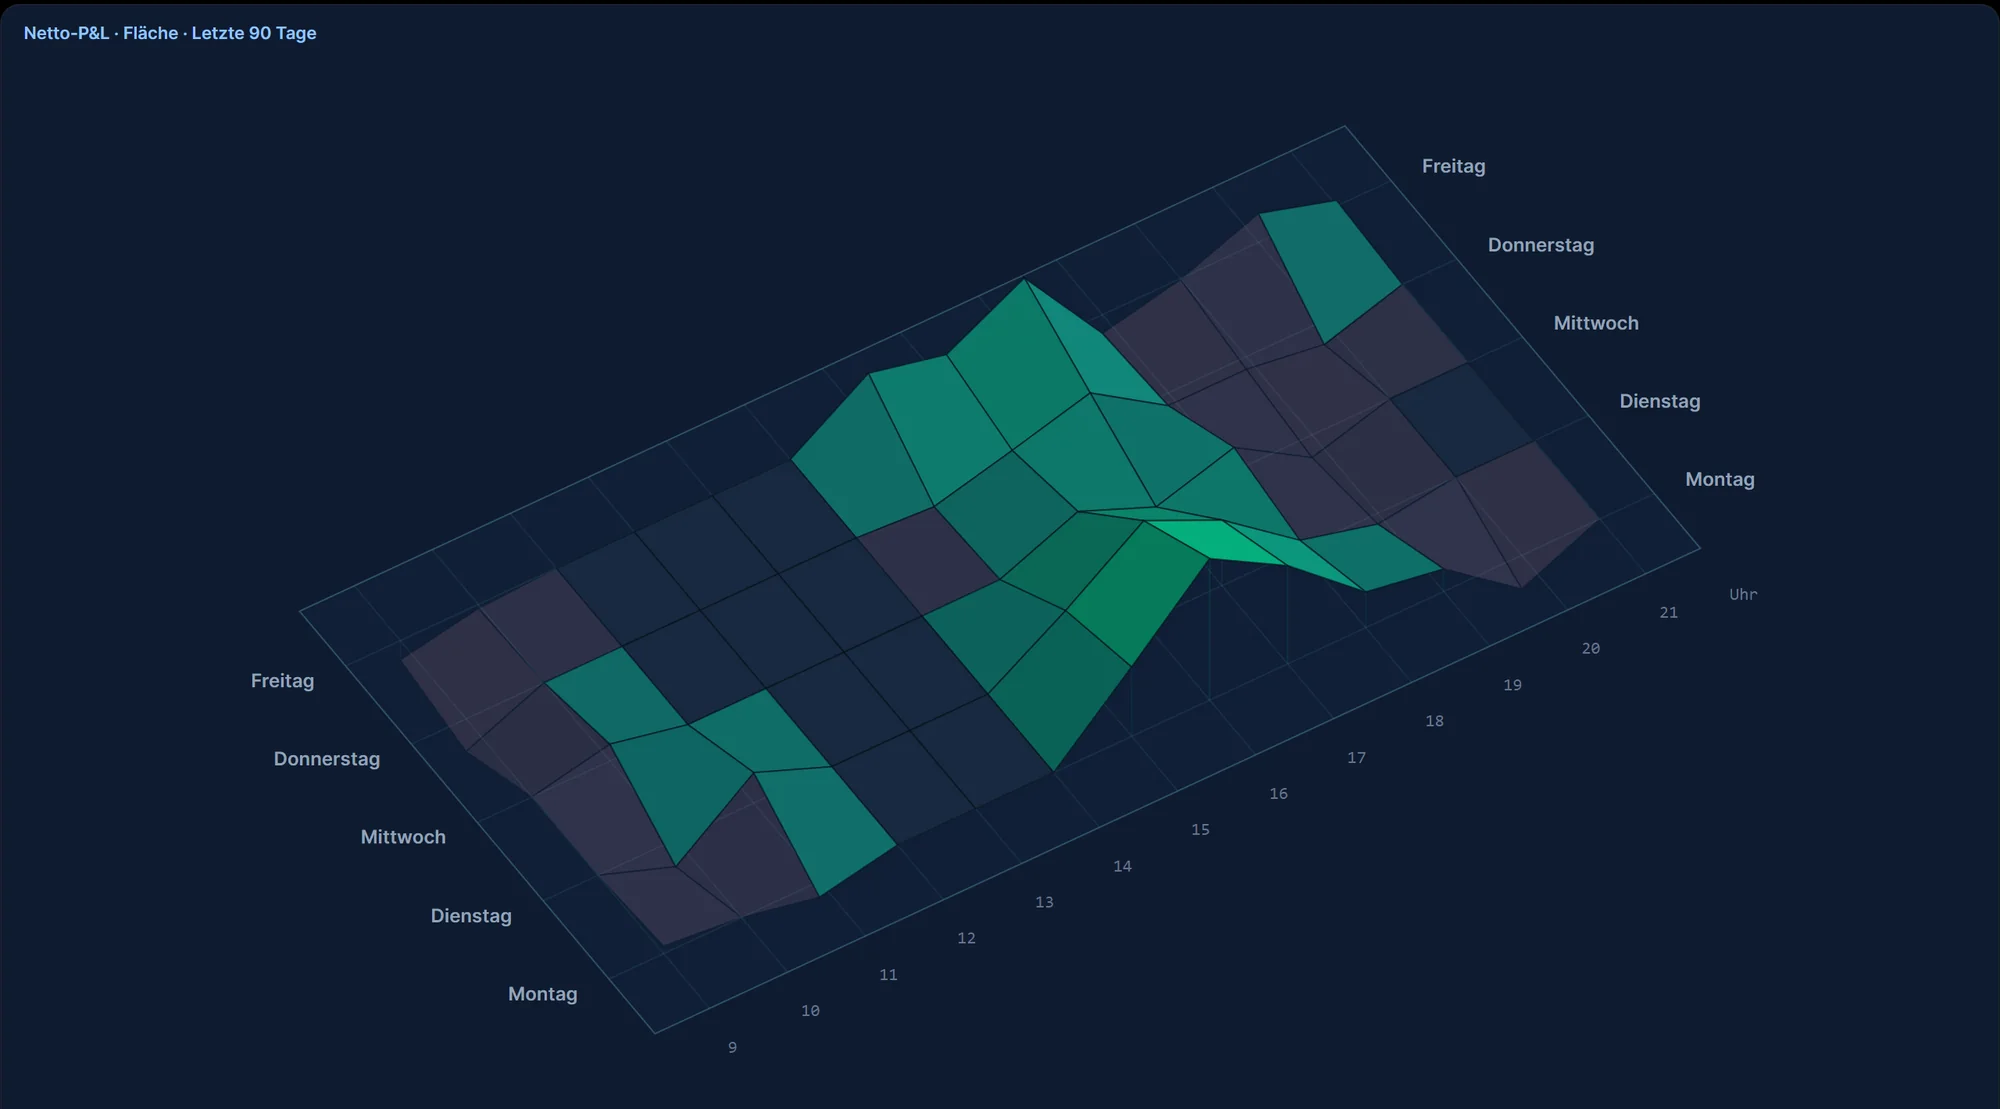
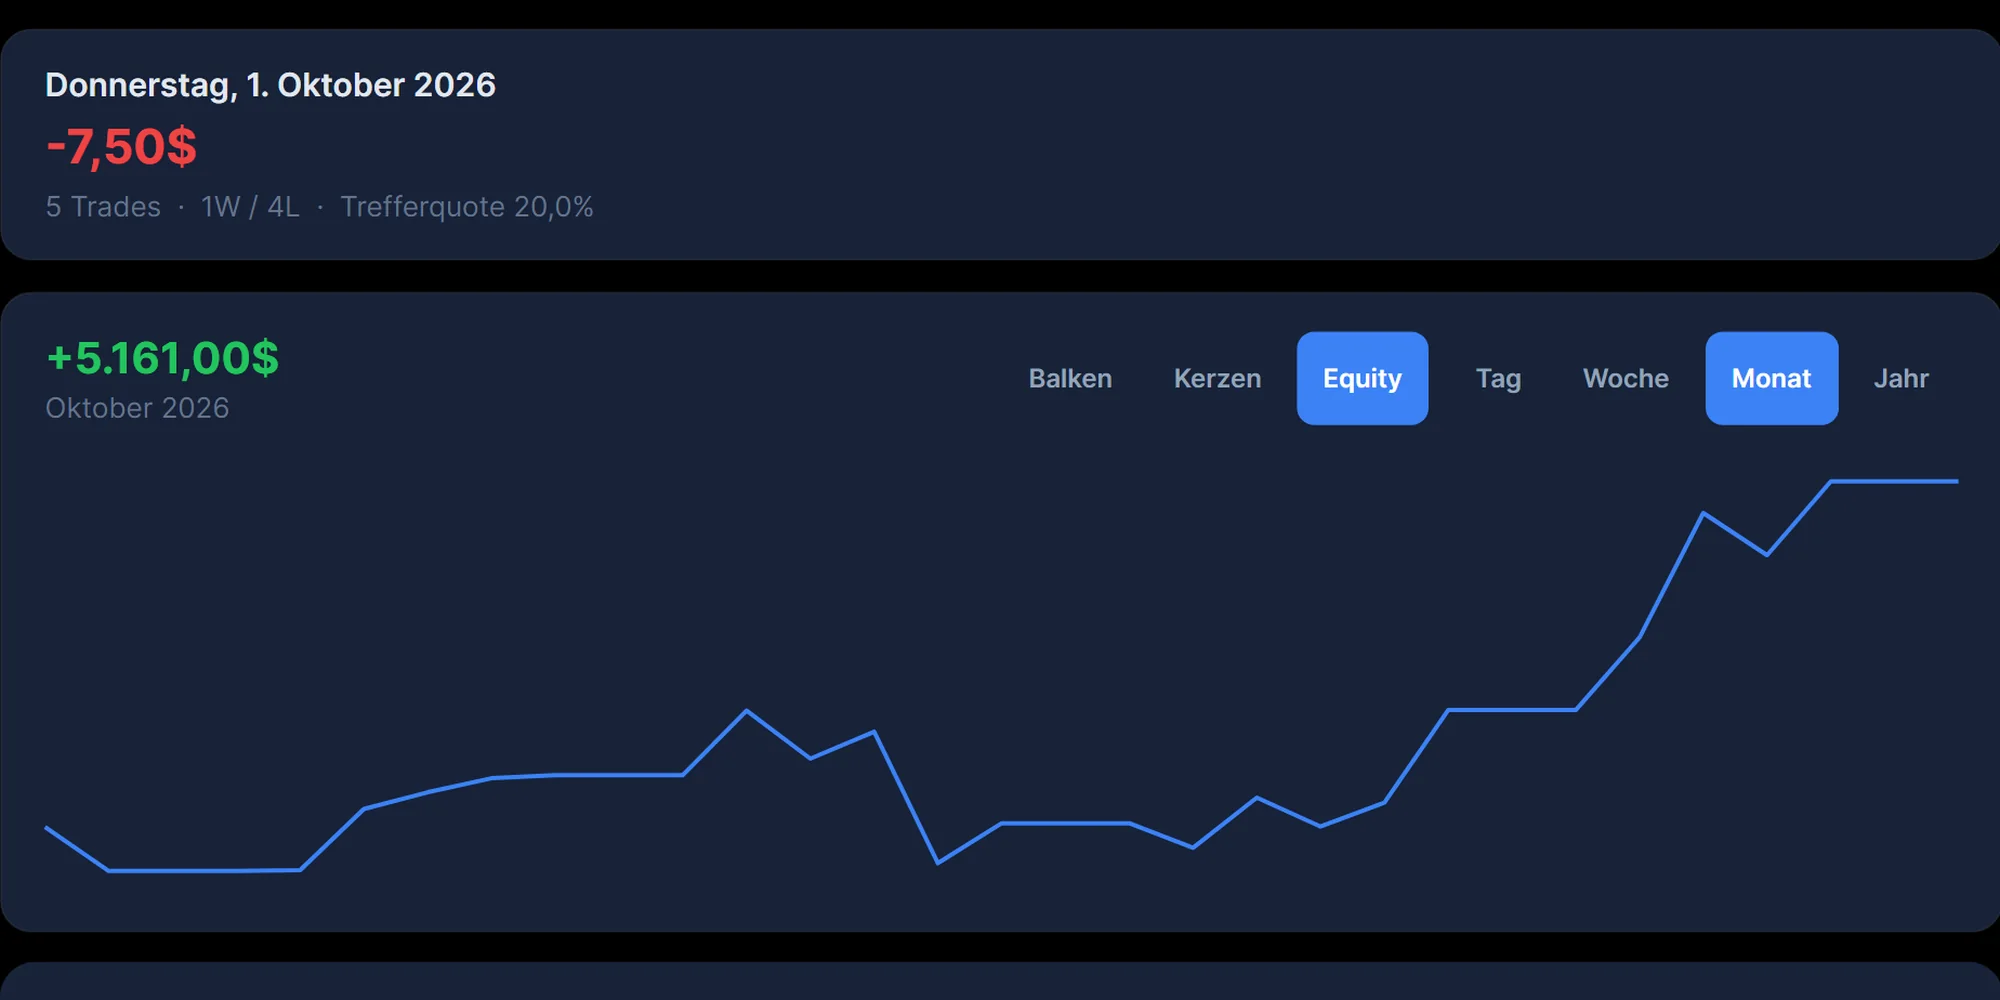
Real excerpts from the EdgeCharts app with demo trades: Trade Score, performance surface and overview of October 2026.
Take a trade, press the camera in the chart toolbar – done. EdgeCharts saves the screenshot automatically to that trading day, right next to your real statistics from Rithmic.
Equity curve, calendar, key figures, markets and times of day – everything filtered by account and period.
Plan, review and improve – the Optimizer tracks everything that happens in your trading.
Write down your strategies with entry, exit, risk and mindset rules – your plan in one place.
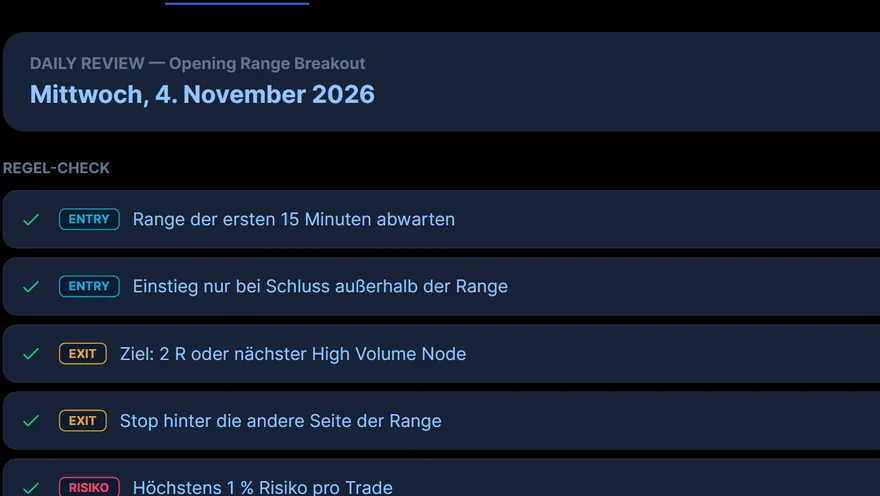
Tick off your rules every day. Your rule adherence feeds directly into the discipline score.
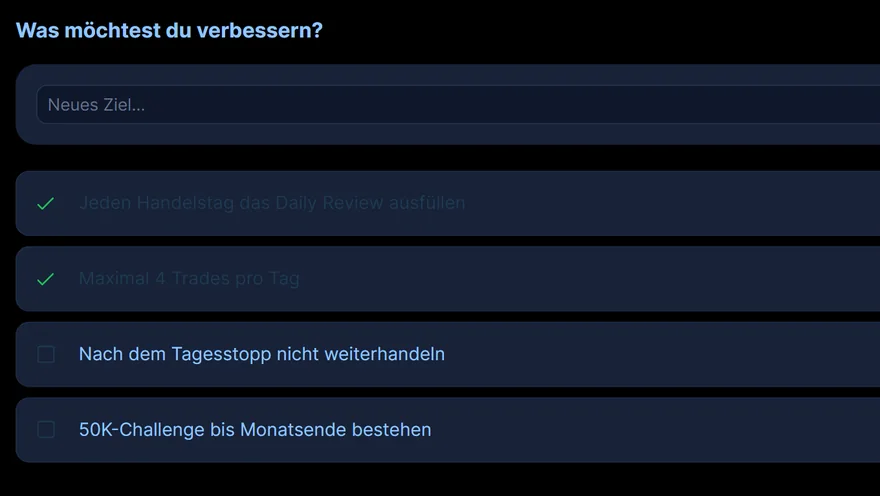
Write down what you want to improve and tick off each goal as soon as you have reached it.

Every trade is tracked automatically – key figures and screenshots, without typing in anything.
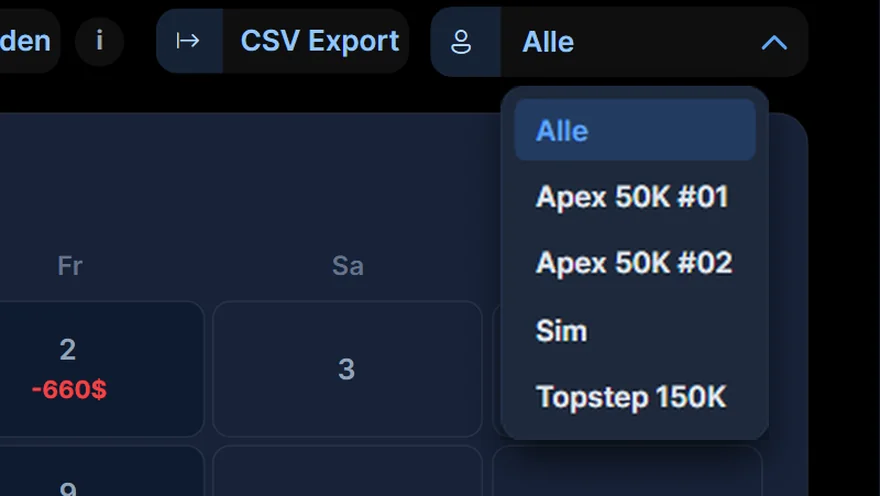
Live, eval and prop accounts side by side – or filtered to one account with one click.
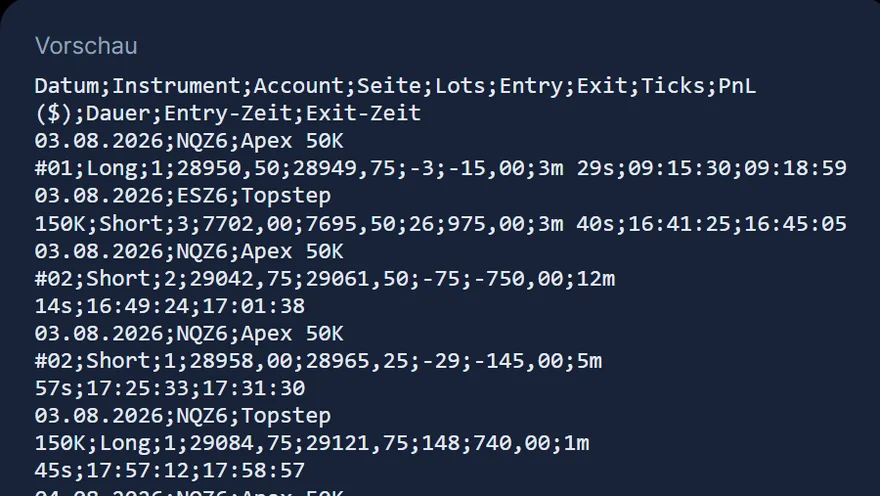
Export every trade with all fields – for your tax advisor, Excel or your own analysis.
Real excerpts from the EdgeCharts app with a demo playbook and demo trades.
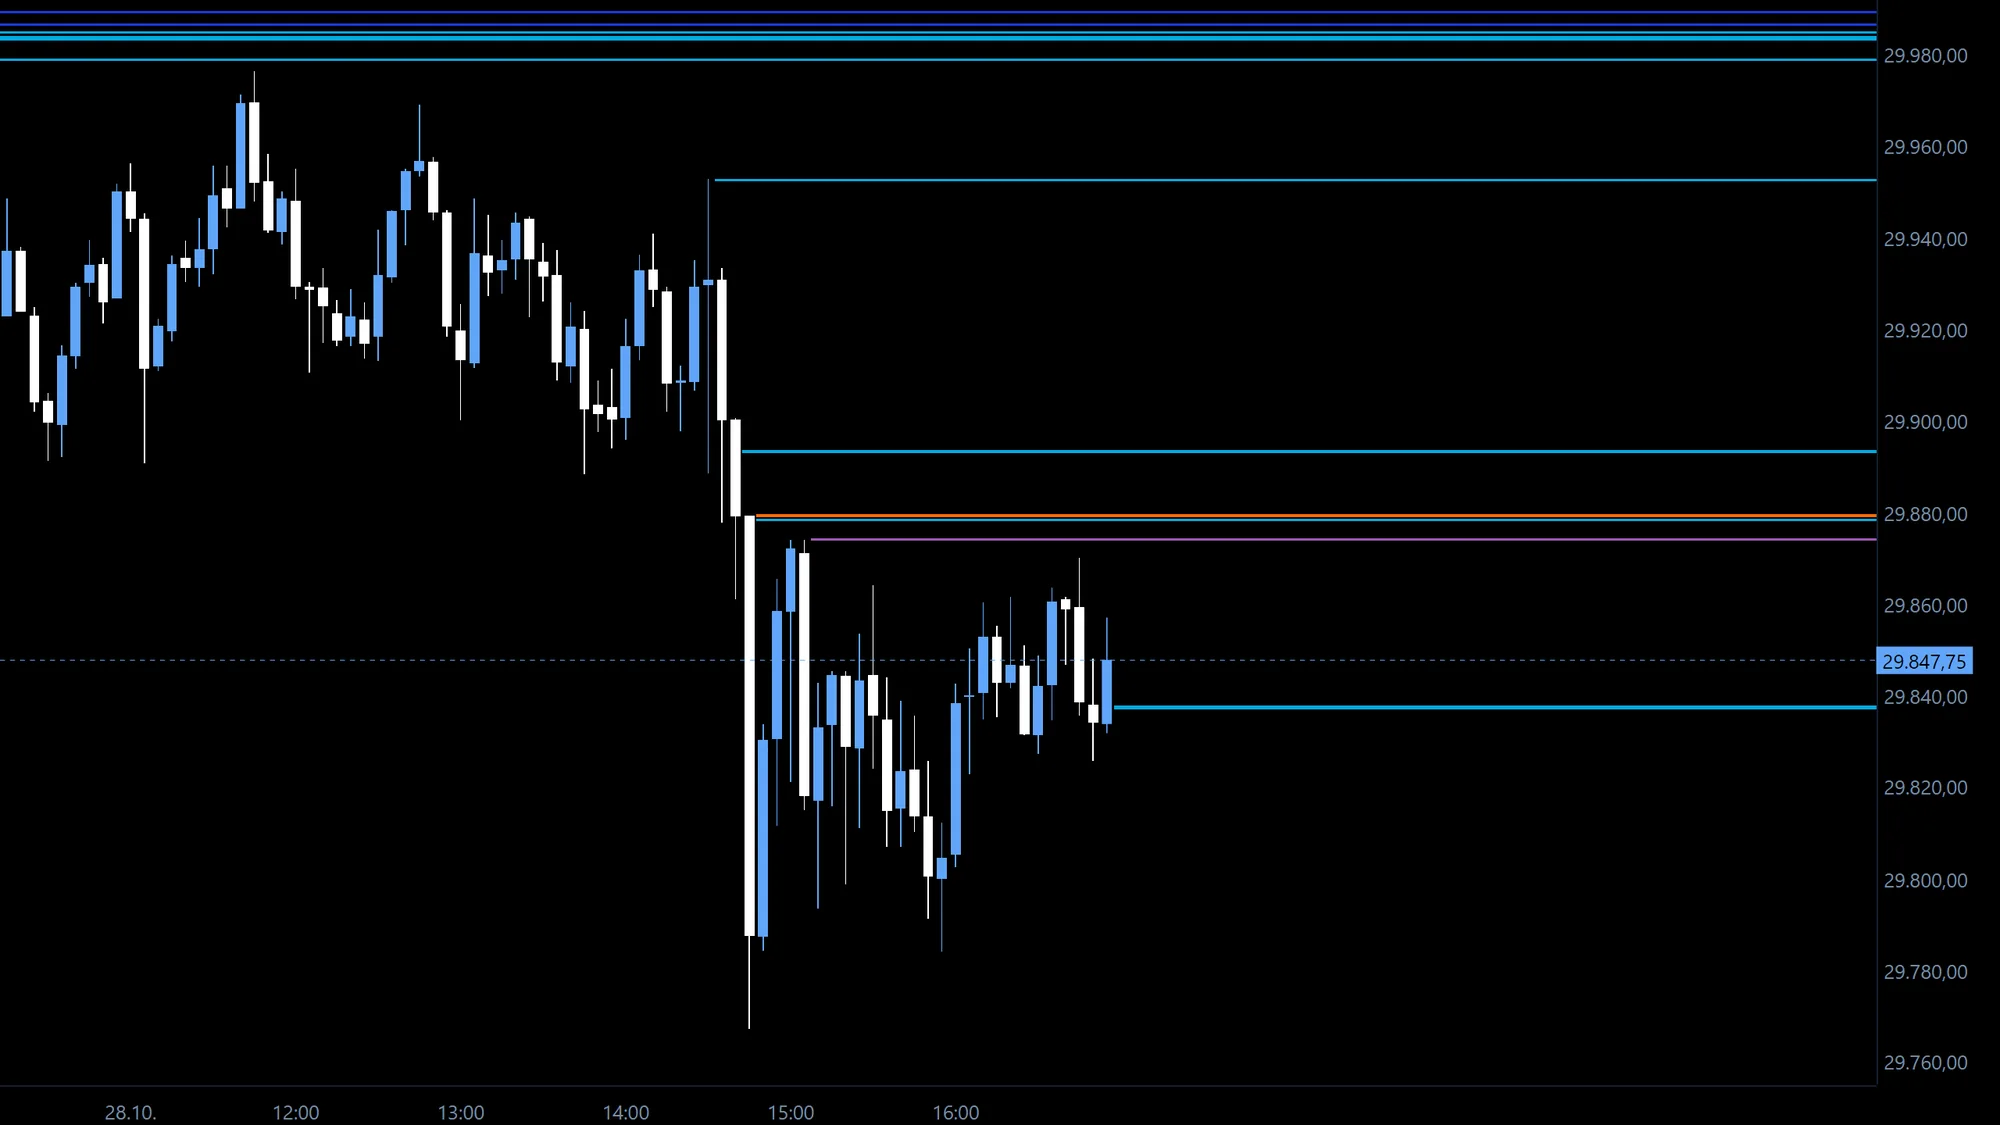
AuctionOptimizer, BiasOptimizer and LocationOptimizer – our own indicators, calculated live in the EdgeCharts chart. What they show is clear at a glance. How they calculate it stays our secret.
Track every trade, see what works and fix what does not. The Optimizer is included in EdgeCharts – no extra journal, no spreadsheets.